Sunday, June 2, 2013

Learn from Losing

Nasdaq 100 on last day of the month.

I initiated a short trade.
Based on the understanding of the end of the consolidation, from a smaller time frame.

I am not a master of trend line.. I don't trade with plotting a new diagonal lines then call them support / resistance, that's not me, but the pattern does suggest a little consolidation and it might end soon.  This is what I see.

while it might have a little range to go up, I wanted to bet on the shorting opportunity.

Market Entry initiated.
SL near previous high. 3020.

Obviously, like the trend line I set earlier.. market did has some range to go, and it reached highest 3023.
Before coming down, dive even below my short trade target.

Overall, this is what happened.

I am 1-2 hours early to enter to this short trade.
Did I make a mistake?
How do I time more accurately, how to improve?

Please enlighten me if you have any.

Monday, May 27, 2013

DJIA and Nasdaq 100

for the week starting 27 May 2013

DJIA Weekly Chart

its amazing to see how the fibo numbers working out... I plotted these since early of the year.

DJIA has hit 15550 levels and formed a reversal candlestick pattern on weekly chart.
Current support 15250 pts.

DJIA Daily Chart

Daily chart heavy swing.
Support 15150 pts.


DJIA 4H Chart


If market break below 15150 pts, it will turn resistance to go south towards 15000.
Strong Support 15000 pts.

This week's view: slight bearish.

Might consider using Fibo Range for this week.

Trade Setup: Fibo Range
Sell : 15,440 pts
SL: 15,480 pts
TG: 15,330 pts, 15,250 pts

Buy: 15,270 pts
SL: 15,230 pts
TG: 15,380 pts, 15,440 pts.

Nasdaq 100

Similar to Dow.  Market formed an early reversal candlestick pattern.
But it is less bearish compare to Dow.

I reckon market to continue surging higher towards 3,070 pts before turning down.
Resistance 3,050 pts
Support 2,960 pts

Current support : 2,997 pts which is also the daily initial shadow entry level.

Fibo Range
Buy: 2,980 pts, SL 2970 pts, TG 3,010 pts, 3,020 pts.
Sell: 3,020 pts, SL 3,030 pts, TG 2,990 pts, 2,980 pts.


Friday, May 24, 2013

GBP/USD on Fri 24-May-2013

Weekly Chart

The weekly candle is showing some possible reversal if GBP/USD stays above 1.5100 for the week.

Day Chart
Potential reversal in GBP/USD is less promising compare to EUR/USD.


Breaking below 1.5000 will continue plunge down to 1.4800.

EUR/USD on Fri 24-May-2013

Up or Down?

I favour down...
But I don't discount the possibility to go up to 1.3200 if EUR/USD successfully break above 1.3000 resistance today.


Monday, May 20, 2013

DJIA and Nasdaq 100


for the week starting 20 May 2013

There have been some good economic data releases such as unemployment rate drops, better than expected growth numbers.
Over the weekend I did a quick survey on the CPI (Consumer Price Index), which is an important indicator for inflation of the economy.  It seems that, along with a monthly 85 Billion bond purchase program, the economy didn't inflate much... either the eurozone debt crisis has dampen the supply, or indirectly it implies the market is still weak.

However, stock market is bullish, DJIA has risen above our target level of 15250 pts.

DJIA last done 15350 pts.
And we forecast market to continue the bullish sentiments.

There are some rumours about the Fed might consider cutting down the bond purchase program, or the MBS (Mortgage Backed Securities) as we continue seeing good numbers from job market, the decision from Fed, or the next policy review shall fall in mid/end of June 2013.

Most likely the bullish sentiment shall continue and we are looking toward 15550 pts.

Support 15300 pts
Strong Support 15200 pts
Resistance 15350 pts
Target 15550 pts

Saturday, May 18, 2013

How much to produce a 2000 words article...?

Since my contribution in the magazine, I have been writing 1000 words...

My first attempt of writing 2000 words, I need to read a lot more than I have ever imagined.
In such a short period of time.

Find all analysis, fundamental data.. quoting the source..
Thanks to internet, thanks to Google, thanks to many researchers and analyst who shared their opinions.

I learned a lot from writing.
Because, to write, I have to read...
Because, I learned a lot from reading your good articles.

Bloomberg, CNN, Reuters, CFTC, UK, US, Euro...
EUR, GBP, USD, JPY.

Time to off from FX.
Time for indices.

Thursday, May 16, 2013

Keynote Speech, Day 2


SaaS is gaining popularity here in Malaysia, when we talk about cloud, people start to understand us better, thanks to Apple Inc, I think they educate us with free cloud experience and his cool mobile gadget – iPhone, iPad, iPod Touch, etc. (obviously, I am an apple fan).

I watched the live webcast of the keynote speech by NetSuite CTO last night.
NetSuite – World #1 Business Suite on Cloud, #1 Cloud ERP.

For the first time, in 10 months, I get to see Evan Goldberg in a live performance.  I get to see his face, listen to his voice, and I get to meet his wife, met CEO Zach Nelson.

We are one of the partner with NetSuite in Malaysia.  We are a special company, since our joint venture, we have SaaS, Infrastructure, Hardware, On-Premise solution, Data Center, and Software Development.

I am looking forward to the user experience overhaul in future releases.
I am looking forward to the mobile app ver 2 which will be released in months.

Monday, May 13, 2013

DJIA and Nasdaq 100

for the week starting 13-May-2013

US labour market data showed a steady recovery boosting the dollar, causing the drop of gold price to $1430.

Last week Dow has shot another record high closing since 2008, DJIA surpassed 15,000 pts.
This week we foresee DJIA to find support around 14,950 - 15,000 pts and continue to advance further towards 15,250 pts.

Daily Trading:
Enter long when market is testing 15,000 pts, target exit 15,150 pts.
Daily Resistance 15,160 pts.

Nasdaq 100
Similarly for Nasdaq 100
Support 2945-50 pts,
Resistance 2985-2990 pts.

Saturday, May 11, 2013

Resume... Ayumi update

I was quite bothered with Malaysia General Election.
Was following the news on TV, postings on social media.
And .. failed to allocate time for trading and forecast.

After a week of ''rehab'', I will resume with my regular postings.

Last week was a fun filled week.

Debt Free

I managed to cancel my 3rd credit card, Citibank Cash Back Platinum (Visa), RHB Platinum (Master), Standard Chartered Gold (Visa).
And called HSBC to cancel my card application.

Leaving me with UOB One Card (Visa) + UOB Lady's Card (Master) and Citibank Clear Card (Master)
Lady's Card is cool (Read more).

I enjoy the lowest credit limit from both banks.

Relieved.

Career Expansion

Work

The new team, is smaller.
As I blog earlier... [Related Post]
I doubted whether the new team would be as open as what and how I used to enjoy.

Pros:
Effective Team
Assertive Super Sales Girl (wow, she is really classic, she is assertive, but she is not offensive, I like her!)
I get more chance to configure the system for product demo, I get more exposures to solutions, and the senior consultant, he is helpful (I couldn't say I like him, but, he gave me a totally opposite personality now)

I heard that he was aggressive, crafty.
After joining the team, I can understand his pain better, and there's no way a normal person could handle situation as such, without showing much anger or resentment.  He gained my respect as a senior application consultant, the pioneer of NetSuite in KL (as far as I know of).

Dance

Finally we met!

I started learning dance from this academy, and you know, when I am given a choice to return to this academy, to teach, I feel glad.

After months and months of postpone, schedule and reschedule, we met!
The principal shared much of her experience and expectation with me.

I admire her, she kept her carefree personality, take tough things easily, responsible, even though she has to face many sakai (crazy kids), adults, and instructors..

We are starting up 3 new classes for kids bellydance.
Not one, hello.  She planned 3 classes.

"Keeping my Saturday free", this rule has been compromised.
I value this relationship, I value the opportunity, and more importantly, I want to learn to communicate with kids.

Review

Life has been good, it is a good year.  It is going to be a good year, as long as I keep my commitment.
Be Strong, Be consistent. 7 months to go.  I know I can do it.

I passed my debt crisis, now I regained my freedom, I understands, I was silly.
From this period of life, I learned an important lesson,
people who are suffering, may not feel suffer.
the process to fight for freedom may not be as tough as it seems.
Be considerate.  Take it easy.  If you want to solve a problem, be patient, do it with your heart.

Believe in God.

I read something great today:
Don't underestimate people in pain,
some may be good hiding them.


Thursday, May 2, 2013

Labour Day Holiday

Its 2nd May 2013 now, 3 days to 13th General Election (GE13) in Malaysia.

I get to read and watch some videos online.
And I read a few blogs.
I am casting my vote this Sunday.

I like:
颜江瀚 Gan Jiang Han
Valyn Lim
Valyn Lim - 我,人民的声音
Entering Into Politics, the Story Behind by 杨美盈 Yeo Bee Yin


Wednesday, May 1, 2013

Iron Man 3

Watched this last night.
Great mind, we have vulnerable part too.

http://entertainment.inquirer.net/91979/going-back-to-basics-tony-stark-shows-vulnerability-in-iron-man-3

Like.

I have completed 7 days detox program, will blog my experience later.

Monday, April 29, 2013

DJIA and Nasdaq 100

for the week starting 29 Apr 2013

Ladies and Gentlemen, Boys and Girls..
I had too much activities over the weekend.
Dance Classes, choreographies, Dance Practise, Movie, Shopping, Detox-ing, Meeting friends, passing Souvenirs, Photo-shooting.

So this week I skipped news.. :p

Technically DJIA has trading in small range last week, I reckon market to continue swing in coming week, with a slightly bigger range from 14400 - 14800, bias down.

Resistance
R2 14880
R1 14780
Support
S1 14670
S2 14470

I stay out during this type of market condition.

Let's say after my presentation tomorrow, I am free wanted to take position, I am going to use Fibo range:
Short 14780,
Long 14600,
SL 45 pts, TG 130 pts.


Nasdaq 100

More volatility.
Support 2820 pts.
Resistance 2880 pts.

if market is  trading higher and close above 2850 pts, it has great potential to mark new high.


Little live

I find it interesting when someone flip to that magazine, and saw my face, and text me.
I feel happy.

This is not recognition.
Plain, ego.

Just have fun, take it easy.

I've been to the beach today.
It is a great outing, with a few new friends.
Laughter, Good Food, Good Photos.
Well, first time I get to see myself in red, without looking like a she-man.
Live life.
I like.

Wednesday, April 24, 2013

USD/JPY on 2013-04-23

This is scary

Can u see the long shadow in one of the 30 minutes candle?

I was having a Long position.

I was tired and sleepy.

And luckily I moved stop loss to entry, came out of the trade at zero profit zero loss.


- Posted using BlogPress from my iPhone

Tuesday, April 23, 2013

DJIA and Nasdaq 100

Internet Connection go haywire.

My forecast were not completed and I pronounce today as a holiday. :)

for week starting 22-Apr-2013

forecast made on:
23-Apr-2013 (Tue) 12:15am (GMT+8, SG/MY Time)

DJIA

DJIA has fallen towards important support level 14450 pts, lowest 14,462 pts.

I believe market is going to test this support line for 2 more times before the next trend.
I favour up.

Resistance 14,630 pts.
From intraday 4H chart, this week's market is slight bearish.  Prone to selling pressure, to 14,450 pts.
Once 14,450 pts then it shall continue the fall towards 14,320 pts, then 14,150 pts.

Nasdaq 100

Nasdaq 100 is slight bearish but just crossed and trading above EMA50 (4H), if Nasdaq 100 can sustain above 2,798 pts, it might go up to 2,810 pts then 2,835 pts.

Otherwise will revisit support levels 2,745 pts, 2,730 pts, 2,690 pts.

Cheers
Ayumi

Monday, April 22, 2013

DJIA and Nasdaq 100


For the week starting 22nd April 2013
This is the second Sunday I enter my blog from this land.
Still not used to the timing.
Had Heinz baked beans with eggs and lamb for breakfast. And lamb chop for lunch. So many lamb.
I desperately needed a detox in coming week.
I miss salad, yoghurt, corn flakes...
Indices
US stock market closed Friday session at 14,547.51 pts with little gains (10.37 pts, 0.07%) but overall it collapsed more than 2% for the week.
Apple's share dropped 9.1% on the week.
DJIA


Monday, April 15, 2013

Gold and Silver

Gold fall $83.04 since morning (more than 5%)
Silver fall $2.69 since morning (more than 10%)

No sign for retracement.

DJIA and Nasdaq 100

for the week starting 15 Apr 2013

DJIA had a strong show last week, shooting up from 14500 and close just below 14900 at 14865.06 pts.

I have time on my own today... So I sit back, relax, and contemplated.

[ ]
Who would have though market reaching 15000 in Jan 2013?

I believe some of the seasoned traders, experienced traders, or investors would have given this forecast.. and I think I heard sifu D mentioned it, I never take it seriously.

I had a quick glanced through my blog posts, although I am generally bullish, I never attempt to give a wild target of 15k - my weekly forecast normally forecasts 1-2 weeks target levels, this level 15,000 never appear.

Forecast is one side of the coin, the other side of the coin, whether we take action or we let it slipped away, who hold a buy position from January 14,000 to April 15,000?

And who, hold a sell position from January to April?

[ ]
Perhaps some of you have seen this..
I have seen this video, and it reminded me.


[ ]

Many times I wanted to do something new, and I stopped doing something old.
This year resolution - I don't want to try doing anything new, but I want to stick to what I do.
Consultancy, Dance, and Trade.

Keep going, make it work (again), make progress - I can add new elements, learn to handle detail, practice with modesty, being patient.

Well, AiShiang who commented on my blogpost last week, yeah, it has been weeks I stopped blogging FX...
Thank you for being here.


[ ]
[[ Market Talk ]]


According to Data from National Bureau of Statistics in Beijing - factory output in March weakened, China missed its GDP, Q1 GDP slows to 7.7%.

Gold price sinking.

DJIA

US earning data is entering into full swing.
Should be the medicine to drive US Indices Higher.

Current Support 14780
Support 14730 pts
Resistance 14900
Target 15000

Nasdaq 100

Support 2835
Target 2890

Gold price sinking

Last week Gold opens around 1580, and closed at 1480.

It has been down by 5% this morning, Gold is under pressure, trading lower and just broke below $1400.

We foresee Gold price to continue falling sharply lower.
I has just break below a very strong support line and we reckon Gold to plunge towards 1350, then to 1320..


Monday, April 8, 2013

DJIA and Nasdaq 100

for the week starting 8 Apr 2013

Last week when Dow is trading at 14600, I wished to short and market did come down to 14450 area and closed above 14550 pts.  This hunch worked quite well, except myself bite the bullet to short.

US payroll data (NFP) has risen less than forecast.


Daily Chart: Uptrend intact, we are still looking at 14700 pts. target.
if market is going to retrace, day chart support 14,387 pts.

Intraday 4 Hour Chart:
Market broke below EMA50 and touched 14450 pts last week.
Uptrend is still intact except with a little bit of stronger pull back.

This week, as the earnings unfolds, we want to watch Dow marking new high (breaking above 14700); failing to do so and resisted below 14630 pts would be an early sign for market retracement.

For the first time... after long time.  I want to short, and my trading plan:
Short @ 14580
SL @ 14630
TG @ 14450, 14380

I am still sticking to short term trading - trade 1 to 2 days than to hold for 3 or 4 days up to weeks.

Cheers
Ayumi

Monday, April 1, 2013

DJIA and Nasdaq 100

for the week starting 1 Apr 2013
2nd Quarter begins today.
It was a big change day today.
I am moving up from my current office, to 8 levels above.
Although I still works in the same enterprise, but I get a new team, they are relatively smaller in size.
I get a new team!
Though I am not excited for the time being, as I still moan over losing my current team, I miss the great time together, great office, great challenges.  I am not sure how the new team would be able to embrace the challenges in a friendly manner as we did.
I hope, by stepping into the new office - I will get excited again.
Yesterday once more, different people, same product, different ways to manage.
Wall Street
2nd Quarter begins..
So we are looking forward to NFP by Labour Department, this week.

Economists surveyed by Briefing.com are expecting the U.S. economy to have added 178,000 jobs in March and the unemployment rate to hold steady at 7.7%.
This would mark a pull-back from the February jobs report, in which the Labor Department reported that the economy added 236,000 jobs, much stronger than the 119,000 added in January.


DJIA
Market closed at 14,578.54 pts last Friday.
New highs, new expectation for pullback.
Not before reaching 14,650 - 14,700 pts, next target 15,050 pts.
Uptrend intact, keep testing EMA50 support line (4 hour chart)
Strong Support 14500 pts.
With European crisis back to the limelight, I take short term position (1-2 days) than to sit and hold for days, even week.
Today's trade:
Enter Long at 14,560;
SL 40 pts @ 14,520 pts;
TG 120 pts @ 14,680 pts or EOD.
Nasdaq 100
Nasdaq 100 is slight bullish compare to DJIA, support 2800.
Resistance 2835.
Enter Long 2814 pts;
SL 8 pts @ 2806 pts;
TG 1: 2831 pts
TG 2: 2839 pts or EOD.


Cheers
Ayumi

Monday, March 25, 2013

Transaction

Stopped out!


- Posted using BlogPress from my iPhone

Transaction

Long Dow near 14550.
SL 50 pts
TE 150 pts


- Posted using BlogPress from my iPhone

DJIA and Nasdaq 100


For the week starting 25-Mar-2013

Hi everyone, sorry for the late update.  My schedule is pretty tight this week; I just had a full day discussion and presentation, followed by 3 days conference in KL.

The week started off with Asian Stocks Rally, followed by European shares open higher.  Cyprus, International lenders reached draft bailout deal, and the government shall impose capital controls on banks.

As per what soulfire has commented on my post last week, yeah, indeed, Cyprus bombshell!

This Tuesday, I am looking forward to Fed Chairman Bernanke speaks (Tuesday 1am, GMT+8 = SG/MY Time)

DJIA

With US30 (FXCM) opens and break above double top, market is going another wave up towards 14,800 pts.

EMA50 (4 Hour Chart) does its best to show support near 14,460pts now.
Market is currently trading near 14,570 pts.

Intraday (1 Hour Chart)
Market has traded near its session high and I reckon market to trade sideways bias down until US market begins in 3 hours.  Hope that it could retrace to find support near 14,530 pts. for me to initiate long, Target exit 14,700 pts. / EOD.


Nasdaq 100

Similar to Dow, Nasdaq 100 has break above last week’s high and it is going towards 2,830 pts.
Currently trading at 2813, Support 2805 pts., target 2830 pts. / EOD.

Cheers
Ayumi

Monday, March 18, 2013

DJIA and Nasdaq 100

for the week starting 18-Mar-2013

Today, is the last day of service for my crazy colleague, whom I regard him to be a friend.
They said, if you have a crazy friend, you have everything.
I am glad I know such person existed.

Little brother, farewell!

-------

DJIA fell 0.2% last Friday, ending the longest winning streak since 1996.
U.S. dollar weakened. The yield on the 10-year U.S. Treasury note dipped to 2%.

The euro zone struck a deal on Saturday to hand Cyprus a bailout worth 10 billion euros ($13 billion) – Cyprus is the 5th country receiving financial help during Euro-Zone debt crisis, after Greece, Ireland, Portugal, and Spain.

DJIA

Weekly Candle: The weekly candlestick pattern suggests early weaknesses in DJIA, we suspect market to trade lower in the coming week to 1/3 fibonacci retracement level around 14300 - 14350 pts.


This week in US we have some housing data on Tuesday night (SG/MY Time), and most importantly, Fed announcement on Thursday 2am, and Thursday night on manufacturing data and employment data.

For the beginning of the week, we reckon market to trade sideway bias down towards support near EMA50 (4H) or 1/3 Fibonacci Retracement Level aroudn 14300 - 14350 pts.

Then to accumulate strength and turn up upon positive data releases to form new high, breaking 14,550 pts towards 14,700 pts in the coming week.

Or turn down upon negative news releases to test support 14,150 pts.


Nasdaq 100

Similar to Dow.
Early of week, bearish.
Support:
2760 pts
2750 pts

Two Scenario:
Upon bad data, will dip to 2712 pts

Upon Fed new financial aid, reverse up, recover to
2780
2810
then retest previous high 2835.

Next to target 2855 (in coming weeks).

Tuesday, March 12, 2013

DJIA on Tue 12-Mar-2013


Hiring Picked up in February, the U.S. economy added 236,000 jobs in February; unemployement rate down to lowest level (7.7%) since December 2008.  The increase in jobs and decrease in the unemployment rate were better than expected.

Within this 30 minutes of NFP report, market swing and it was thrilling seeing the actions.


Tuesday 12-Mar-2013

Sorry for being late posting my forecast.  Market has reached higher and currently trading at 14,444 pts; market is trending higher and stochastic is high but no signal of turning down.

Next Target for DJIA: 14,550 pts, 14,700 pts.

Current Support 14,300 pts

Strong Support 14,200 pts

Today’s setup: Initial shadow long, enter Long at 14,420 pts, SL 13,390 pts, TG 14,550 pts / close EOD.


Thursday, March 7, 2013

DJIA on Thu 7-Mar-2013

I entered short once, market swing, I am out.

Waited for 2 hours, market is quiet.  Trading sideways and returned to 14300 again.
Since it is close to the closing bell, I don't think I want to enter short at this moment.

Reckon market to retrace from current high 14300 pts to 1/3 retracement area 14200 pts.

For trend trading I would wait for long entry near 14200 pts, for short term trading (intraday) I will short near 14300 and target exit current support 14200 pts.


Cheers
Ayumi

Monday, March 4, 2013

DJIA and Nasdaq 100

for the week starting 4-Mar-2013

Me and mentor, we had a little chat.

I long US30 (DJIA) last Friday after formation of the EMA50 in 4H chart.
Mentor says : Oh no~~~~!!!! You are anti-recession.
Hahaha target to close at 14150 pts.  Currently floating 66 pts. profit.


DJIA

From Economic Data front, US shows positive consumer sentiments, ISM Manufacturing PMI is better than expected.

The current chart pattern formed a higher high and a lower low, it looks like a trumpet, and it is hard to trade nowadays if you didn’t protect your trade with Stop Loss.

I am anti-recession.
Market shall go up, higher and higher.

It has reached 3L target last week at 14,120 pts. (the level I been waiting for months!)

A new PowerWave has formed with last week’s candlestick pattern, it can either be a new down wave, or an inner wave and the extension of the up wave – beware!

This week, we forecast market to challenge all time high (2007) 14,270 pts.

This week:
Resistance: 14270 - 290 pts.
Resistance: 14150 pts.
1st Support: 14000 - 050 pts.
Strong Support: 13850 pts., breaking below this level would trigger to bearish sentiment

Monday:
Long with initial shadow, near 14000 – 14050 region, SL 50 pts. from entry, TG 14150, TG2: 14250 – 14290 pts.

Once market has breakup above 14,300 pts., market might reach 14,650 – 14,700 pts. within this month of March 2013.


Nasdaq 100

Hope for another bullish candle to resume up trend.

Target: 2785 pts.
Resistance: 2760 pts.
Current Support: 2735 pts.
Strong Support: 2710 pts.


Sequester news going on.....
watch for opportunities

Monday, February 25, 2013

DJIA and Nasdaq 100

for the week starting 25 Feb 2013

Ops! Its 10:40pm (GMT+8) here and market has opened almost an hour ago.
Market has gained 37 pts, last done 14,037.63 pts (+37.06%).

Sequester
governors from around the country were gathering in washington last weekend for the national governors association winter meeting. The delayed sequester is scheduled to hit in March.

Related video:
http://live.wsj.com/video/seib--wessel-sequester-cuts-likely-to-kick-in/1F74EB22-52AA-4CC0-B5F6-07880521436F.html

Well I do think that US will once again propose to raise debt ceiling, introduces some other means to ease economy.

DJIA

Weekly Chart:
last week market found support near 13850 pts (low 13836 pts) and closes above 14000.
With this market pattern, we suspect market to be volatile this week trying to hit higher high.

Daily Chart:
Last Friday was a positive day, market gained 119.95 pts to 14000.57 pts from previous close 13880.62.

market is trading near overbought area and 14000 has become a temporary support should market continue to try higher.

14120 pts.

Well I do hope a healthy correction to EMA50 (4H) support near 13,970 pts - before market hitting higher high.

I would prefer to intiate Long at 13,970 pts area.

Immediate target 14,120 pts, Target 14,200, 14,450 pts over March 2013.


Nasdaq 100

Nasdaq 100 is volatile.  Big up, Big down.  Exciting.

Forecast market to test support before turning up to try higher high towards 2815 pts

Support 1: 2750
Support 2: 2710
Support 3: 2680

Target 1: 2780
Target 2: 2815

Cheers
Ayumi

Sunday, February 17, 2013

DJIA and Nasdaq 100

for the week starting 18 Feb 2013

Last week University of Michigan's February report on consumer sentiment came in at 76.3, above a 74.8 forecast, this week’s major annoucement fall on Wednesday 9:30pm – Building Permits and PPI, Thursday – FOMC Meeting Minutes, Core CPI, Existing Home Sales, Philly Fed Manufacturing Index.

DJIA

DJIA closed just barely higher but formed a bearish candlestick pattern on weekly chart.

With the new high formed last week, at first I was a strong believer that market could look up above 14100 to hit 14,120 pts.  Instead, market fall to support above 13900 and closed at 13,981.76 pts last Friday.

I am getting back to my belief that stocks / DJIA needs to face correction by end of this month (February) and extend to March.

Related Post: http://ayumi216.blogspot.com/2013/02/djia-and-nasdaq-100_12.html
I maintain my forecast of the market.

current phase: market swings, correction awaiting breakout either to the top or bottom.
Breaking up above 14000, market is going to hit 14120 pts.
Breaking below - target 13850-875 pts, 13630-650 pts.

Nasdaq 100

Nasdaq 100 short term forecast: rebound from current low 2760 pts, to resistance 2770 pts.
enter long near support 2760 and enter short near 2775

Cheers
Ayumi

Wednesday, February 13, 2013

Dow! Dow! Dow!

Dow hit best level, and it breakup.

Currently trading at 14,040 pts.
Target 14,120 pts.

Go go go!

Tuesday, February 12, 2013

Transaction

Short DJIA / US30 (FXCM)

Instant execution 10:06pm (GMT+8) to short at 13980 pts SL 14010 (30), TP 13890 (90) or close by 12am (GMT+8).

Also parked another order to short at 14000 pts, pending.


- Posted using BlogPress from my iPhone

DJIA and Nasdaq 100

for week starting 11-Feb-2013
It was a nice call to short yesterday, I reckon market to continue trading below 14000 pts.
Intraday trading:
From smaller time frame - 30 mins, market is trading at support level 13950 pts, breaking below would bring it down to 13850 pts.


From higher time frame - 4 hour, market is trading above EMA50 support, breathless, as I can see the market is consolidating and awaiting breakout either to top or bottom.
Breaking up - target 14120 pts.
Breaking below - target 13850-875 pts, 13630-650 pts.


Nasdaq 100
Nasdaq 100 chart is weird to me...
I do not know how to trade this market and neither I am able to interpret them.
Lets try,
Nasdaq 100 is bullish, with bearish candlestick pattern.


trading above support, EMA4 and EMA20 shows bullish sentiment.
take a look from 4 hour chart:
Market has break above resistance with a long bodied bullish candle.
but was then suppressed below 2780 pts.


therefore, from mid-higher time frame (day to week) market is slight bullish.
from small-mid time frame (hours to day) market is slight bearish.
Take a look EMA50 is also the support level 2755 pts.
I would prefer to initiate long near 2755 pts if the support holds.
Cheers
Gong Xi Fa Cai~~ I got many ang pows~~!!!


Friday, February 8, 2013

Update on DJIA

It is a data heavy Thursday.

Economic Data summarry by dealers has to split into 3 parts!
and here you go...
Source: ForexFactory

DJIA / US30 / YM

Data Feed = FXCM (UK)

US30 hourly chart:


I have planned for exit at 14,120 pts as you have seen me posting since 3 weeks ago.
I have stopped out last night with 6 pts profit.

US30 4 Hour chart:

I long black candle, couple with a full bodied white candle - fighting at EMA50 in 4 hour chart.
In which, it shows the bull - bear fight and consolidation should take place for another half day.

US 30 Daily Chart:
according to Dow theory, market is going to turn from super bull, to consolidation, to bearish.

Lower high, lower low.
Yesterday's low at 13852 pts is also the support level we identified during our weekly forecast.

It could be a good buy opportunity but I have missed it.  Market is trading  about 100 pts above support level.  I reckon the bearish sentiments to kicks in from now and market should face resistance near 14000 region.

Initiate short near resistance, SL 30 pts away, profit target 13,850 pts or close EOD.

Monday, February 4, 2013

DJIA and Nasdaq 100

Ops! I am late!

It is afternoon here at 4pm (GMT+8).

FTSE 100 opened lower, Friday close 6,347.24 pts, last done 6,329.47 pts.
but it has done quite nice for the year to date at +7.32%.

Last Friday we have positive NFP, improved US consumer sentiment, better than forecast Eurozone economic data and sustained growth in China - easing worry of demand in the world's 2nd largest economy, US market has flirted above 14,000 pts (I am excited!)

US did not fall off fiscal cliff, and the debt ceiling issue were now pushed to May-2013.

This week, the financial earnings comes to full force and we reckon market to continue sky rocket higher in line with many positive reports as a result of continuous stimulus from Federal Reserves.

Trade with caution as the strength of the bull is now at its fullest, market couldn't go up all the way,
therefore, we reckon a healthy pull back to be in place - so be prepared, the bull might be exhausted when we are trading towards March 2013.

DJIA / US30 / YM

Market - bullish
Short term support: 13,950 (1/3 retracement of Friday's H-Lo)

As per our forecast since last month, after hitting 14,000, next target is 14,120 pts.
Grab it!

Related:
Forecast 28-Jan-2013
Forecast 21-Jan-2013

Nasdaq 100

Market - slight bullish
Short term support 2750 pts (1/3 retracement of Friday's H-Lo)

Market revisit resistance near 2775 pts, and we reckon market to continue trading sideways bias up to hit 2775 pts, then 2785 pts and ultimately 2800 pts.

Cheers
Ayumi

Friday, February 1, 2013

Dow breaks 14k

Dow breaks 14k!
In line with better than expected economic data :)


- Posted using BlogPress from my iPhone

Monday, January 28, 2013

DJIA and Nasdaq 100

for the Week Starting 28-Jan-2013

Last Friday, DJIA closes at 13,896.00 pts

Jobless claims was down 5,000 to 330,000 in the week ended 19 January, lower than median forecast; sustained gains in hiring is positive. However, the government might reach USD16.4 trillion debt ceiling in mid-February and U.S. Treasury Secretary Geithner reiterates budget cut.

DJIA

Last week we forecasted market to reach 13,750 pts, and market has risen higher even to reach 13,896 pts.  As per our forecast last week:

Once market has taken out 13750 then it might continue heading north towards 14k, and then 14120 pts. Otherwise we expect some consolidation to take place before another significant trend is formed.

We maintain the same view.

Related Post: DJIA and Nasdaq 100 for 21-Jan-2013


Nasdaq 100

Have you read something about the correlation between Gold and AAPL?
:)

Nasdaq 100 has progress well above EMA50 beginning of last week but on 23-Jan-2013 (Wed) market has formed a long bodied black candle down and erased the earlier gains.

Nasdaq 100 has once again trading around EMA50 and we reckon the same pattern to continue - trading sideways bias up as long as market didn't fall below 2695 - 2700 pts.

No trading signal for Nasdaq 100, no trading recommendation.


Sunday, January 20, 2013

DJIA and Nasdaq 100

for Week Starting 21-Jan-2013


University of Michigan preliminary index of Consumer Sentiment dropped from 72.9 to 71.3, lowest since December 2011.  Economy, employment  is growing at a tepid rate and consumer sentiment is low, market is positive after announcement of unemployment benefit – first time claim of unemployment benefit fall to a 5 year low.

DJIA

DJIA has risen to a 5 year high after the US government reported a sharp rise in number of new homes being built last month, and to the expectation of raising debt ceiling.

From Monthly Chart – so far January candle is a full bodied white candle and it possesses potential to rise higher to close near 13750 pts. for the month.

We generally expect US to raise debt ceiling and equities will continue to rise until the voting completed.

Weekly Candle – bullish
Daily Candle – bullish, capped below 13678 pts.
Intraday: Identified Support near 13,580 pts. and market is likely to continue rising above 13,700 towards 13,750 pts.

Once market has taken out 13750 then it might continue heading north towards 14k, and then 14120 pts.  Otherwise we expect some consolidation to take place before another significant trend is formed.


Nasdaq 100

Market is trading to test support near EMA50 (4H), we observed market rebounded almost every time it tested EMA50.  However, from 30 minutes and 60 minutes time frame, market was trading sideways bias down in the past week but managed to break up on last 4 hours.

We reckon market to continue trading upward on Monday, target limit to 2747 pts., support 2736 pts.

Cheers
Ayumi

Monday, January 14, 2013

DJIA and Nasdaq 100

for week starting 14-Jan-2013 Mon

DJIA

DJIA has been trading slow since last Thursday.
suspect market to face resistance today and consolidate within 13450 - 13520 pts.

If market fall below 13450 then it shall reach strong support 13380 pts soon before rebound up to resistance 13520 pts again.

Nasdaq 100

Reckon market to continue up towards 2775 pts.

However, buying at current level is risky, suggest to enter long when market consolidate and test strong support 2720 pts before resuming up trend to reach target 2775 pts.

Cheers
Ayumi

Monday, January 7, 2013

First trade 2013


First trade of the year.
My humble beginning of FX (again).


- Posted using BlogPress from my iPhone

Weekly Forecast (FX)

EUR/USD

EUR/USD has formed a new X in December when it strikes 1.3307 high.
Beginning of this year it has confirmed the B and currently hit 2L.

after hitting 2L market is currently doing retracement, I reckon retracement up to return to 1.3150.

Intraday chart (30M, 60M) is showing stochastic oversold) therefore upside is limited.

Closing below 1.3150 would lead market down below to 1.30, then to strong support 1.2900 (EMA200, Daily Chart).

GBP/USD

pincer top on daily chart is scary (pin bar top), 2/1/2013.
Market shows support at 1.60.

Last week's trading range is big, its volatile.
Market has not been so interesting after loooong time (since Sep 2012).

While I am waiting for next trend to evolve, I am making an assumption:

market to continue moving up slowly to 1.6180 (EMA50, 4H), resisted, form a reversal down, and return to 1.5950 (EMA200, Daily) and ultimately 1.5850.

IF, market didn't break below 1.5950 but continue up, then I am looking forward to GBP/USD hitting 1.65.

USD/JPY

New prime minister, QE.
Devalue JPY.

USD/JPY up, up, up.

with unlimited printing, USD/JPY is a safe ride - it just keep going up, no looking back.
currently trading at 88.15 region, I reckon USD/JPY to reach  90.00 and 92.80 in January 2013.


Sunday, January 6, 2013

DJIA and Nasdaq 100

I hv been sitting here whole evening, not knowing the time has passed. Time seems to have stopped.

Something has happened.
My mind is somehow disturbed with this new change. And I can't get rid of them.

I hope I can live in harmony with them, the thoughts, the feelings.


DJIA

There are no spending cuts, only tax increases.
Tax bracket increased from 250k to 450k.
The short term solution to the fiscal cliff has bring market to new highs.

Honestly I am not able to sync with the market with the rumors over fiscal cliff and Fed's unlimited money supply.  I would like to say I am jealous.

When I have borrowed enough for next 5 years, I borrow my quota for next 10 years, to pay off what I have borrowed 5 years ago... unlimited money supply and unlimited friendships.  According to news sooner or later (1-2 months) US may face debt ceiling call.

Technical Chart
Weekly Forecast

Market had a bullish week DJIA shoot up, gap up, up and up.

Consolidation is taking place and I reckon market to swing bias up.

Stochastic is high, not high enough.
initial shadow is diminishing and on Monday, I expect market to trade to 13400, then higher towards 13480-500 before stochastic hitting oversold.

Towards Tuesday/ Wednesday:
down to close the gap 13150-13250 pts and resume limited range capped below 13600.  Close the week with another white candle below 13550.


Nasdaq 100

Bullish
downside support 2670, 2690.
Resistance 2780.

Stay out.

Sunday, December 30, 2012

DJIA and Nasdaq 100

DJIA has posted a big long black candle last week.

never expect during the last few trading week we could have this type of market movement.
A new trading buddy AS, he has a breakthrough over this trading system, his trading system is able to tell whether we will have a breakout tonight or not.

combine with other 2 system he has, he has the target price, entry price, and either Long, or Short.
this is amazing...

but still, more is up!  He is going to use Mathlab to program his system, mathlab - this application is for engineer to design and model.. what type of enthusiastic trader on earth could come out with this idea?

He said this is not new to professional traders, oh man, this is new to me.
Mad scientist - he is crazy, and he is the only one person i know one this land who is doing this everyday, and he is always hungry to learn thing, and to make his trading system complete.

clap clap to AS.

back back back to DJIA.

31 Dec 2012, last Monday in year 2012.
We have so many unanswered question over fiscal policy, tax increase and spending cuts, is US going to get over it?  I am quite pessimistic, but I am also curious of what our creative US government and Federal Reserves could do about it.

Last Friday, DJIA has fall and close below EMA200.
From 4 hour chart, the inner wave has hit 3L.

Technical Analysis

Bearish sentiment could halt during Asian hour, and hopefully DJIA could retrace up to 12960 pts.
If market is suspended below 12960, and didn't breakup strong resistance 13080 pts, we might see market going south to hit 4L or even 5L target.


4L target = 12660 pts
5L target = 12500 pts

If there's good news, or any positive announcement from the lawmaker, market would swing up - anyhow it is going to be volatile.

Since I am pessimist, I will go short at any of these resistance level, preferable near strong resistance 13080 pts, it would then for another classic example of EMA50 in 4 Hour chart.
Fingers crossed.

Nasdaq 100

the Trend is  bearish, market has break below strong support.

From weekly chart, this is what I forecast:

therefore, for daily trading, i would prefer short until market fall to 2500 pts.

Short at initial shadow around 2580 pts, SL 10 pts away, TG 30 pts (2550).


2013 ……要来了

眼看ForexFactory都已经显示2013年的经济数据报告公布时间,2013年,近了。

明天将是2012年最后一个交易日,写到这里,我不禁感慨时间稍纵即逝。

舞者的经历

2012年我开了总共5班肚皮舞班,见证学生们从posture姿势,到hip drop,然后再慢慢地将舞蹈融入自己的身体。

时而我害怕,时而我感恩;
害怕很快我就不能够负荷他们的求知欲,
感恩有他们一路陪我成长,甚至成为我编舞的实践品。

Ayumi the Novice Trader 的经历

2012年我认真地学好Power Wave,认真地学好我会的技术分析。
而不是一味地追求不同的技术分析。

当然因为舞蹈和工作的关系,今年trading的时间减少了很多。
我让自己适应高time frame的分析,很意外地,我发现自己的表现平稳了,
因为冲动而盲目进场频率减少了。

打工一族的经历

由一间跨国的印度软件公司,小小的销售人员转到Business Consultant -- 也就是从销售的框框跳出来,投入软件的实践。主要工作便是Implementation —— 从公司的运作,到软件的调整,到加以实践。

由于受不了100%软件操作的工作模式,我加入另一家新加坡公司成为销售经理(也只是和衔头,别太在意),看清自己的兴趣及专长以后,我加入另一家更大的跨国公司担任软体预售顾问。

跳槽,本来就是一件很普通的事情。一年跳3家,简直就是我本人的记录。

接下来,就是努力实践我Dancer + Trader + Consultant的日子咯。
2013年我的resolution很简单,把手上的工作做好,以及避免踏入圈套。


Monday, December 24, 2012

DJIA and Nasdaq 100

for week starting 24-Dec-2012


Gold – being one of the few avenue for investor to store value is hovering near a 4 month low, are you going to hold on to the bearish gold, or hold on to USD which offer 0% interest, and infinite printing power?

Last Friday is a volatile day, market is moving down and up and currently surpressed below 13250 pts, support 13150 pts.

I reckon market to trade sideways between these two levels if no major news outbreak.

I am closing my book and not going to trade for the week and planning to enjoy my holiday.
Short trading week on Wall Street - market will be open for half day on Christmas eve, and off to observe Christmas day, resume regular trading on Wednesday but volume is expected to be light.
Cliff talk is still in the picture - tax hikes, and spending cuts decision will be moving the market.

Monday, December 17, 2012

DJIA and Nasdaq 100

for the week starting 17-Dec-12

Last 2 week of December 2012 were generally quiet for stocks, however, market could be volatile towards end of the week as we are still paying attention to fiscal cliff : increased tax rates, spending cuts in  in January 2013 and expiration of options & futures contracts.

Technical forecast:
Weekly candle: Reversal candlestick pattern signal a bearish market.
Daily Chart: market has retraced 2/3 from October high to November low, with a bearish weekly candle and 3 black soldier, we could expect market to trade within 13,120 – 220 pts. before breaking down to target 13030 pts.
1 Hour chart: market has formed a butterfly pattern and hence we reckon market to be bullish on Monday Asian hour, and return to resistance 13,220 pts.
Hunt for short near 13,220 – 250 pts. and if market traded below 13120 it confirms the bearish sentiment, shift stop loss to entry and set target exit near 13,030 pts.


Sunday, December 9, 2012

DJIA and Nasdaq 100

for the week starting 10-Dec-2012

Listening to some quiet songs (piano) while the city is covered under thick cloud. It is drizzling out there.

I prefer this weather, drizzling, not too much sun.  To me, it’s the type of weather I want to sit close to my heart.  Blogging, reading, listening to music, and dancing, were all of them.  Just, no TV.

Last Friday, NFP result was too good, market become lively again!

Relating to NFP and some job report:
http://www.bloomberg.com/news/2012-12-07/payrolls-in-u-s-rose-146-000-in-november-jobless-rate-at-7-7-.html
http://www.businessinsider.com/nomuras-reaction-to-jobs-report-2012-12

Technical Analysis

DJIA

Friday closing: 13,155.13 pts (+81.09 pts, 0.62%)

Weekly Chart: DJIA posted another bullish candle on weekly chart, and therefore this coming week, outlook is bullish, market should continue towards next resistance 13,260 pts – 13,300 pts.

Daily Chart: Strong Support 12,930 pts

Intraday Chart (4H) market bounced off EMA50 on 4-Dec-2012 and we reckon the upward momentum to continue to 13,190 region before it comes down to test intraday support 13000 pts.

Prefer to enter long on Monday using initial shadow, buy near 13,080 pts, SL 40 pts away, Target Exit 13,200 pts or EOD.

Nasdaq 100

Friday closing: 2,978.04 pts (-11.23 pts, -0.38%)

The rest of the world is bullish, and Nasdaq 100 came down!
Apple, the stock of the largest US company fell 2.6 percent to $533.25, extending its losses for the week to 8.9 percent dragged Nasdaq 100 amid the positive job report.

Weekly Chart: neutral, market trading below strong support 2640 pts by 2 pts.

Daily Chart: bearish, if market could not break above 2650 pts but traded below 2640 pts, there is a high possibility market continue to go down.  Otherwise, breaking above 2650 market shall retest swing high 2674 pts, an ideal level for a new short.

Intrady Chart:
This Monday, I reckon market to trade sideways bias up, to 2650 pts.  Intraday resistance 2653 pts.
In fact, market has just create a new XAB downwave.

I am soooo into shorting, selling Nasdaq 100.
Throughout the week, my main objective is hunting for EMA50 rejection (4H chart), short with initial exit at 2630 pts, TG 1 2595 – 2600 pts.

Wish everyone another profitable trading week ahead.

Cheers
Ayumi

Tuesday, December 4, 2012

Transaction

Long (buy) Gold at 1696.05


Monday, December 3, 2012

DJIA and Nasdaq 100

for the week starting 3-Dec-2012

DJIA

Last week DJIA formed higher high, higher low - it is bullish after testing strong support 12800 - lowest 12763, and ended almost flat for the week.

It’s December already! Hopefully reports on the job market (NFP, Friday), manufacturing (PMI, Monday, Wednesday, 11pm) and consumer spending (Friday) this week may provide the market with a jump start.

Good, or bad.

Market seem bullish after testing 12800 pts., but returning to 13030 pts. also means that DJIA has recovered 50% from the fall since early Oct-12 to mid Nov-12.

Bad habit – I am waiting for a short signal.
Waiting, means no short trades for the week except NFP and consumer spending (watching).

But there are also a few clues that market may continue trading higher – first clue: market closed above EMA200.  Oscillator is oversold.

May be, it will return to 13200 pts. – 2/3 from the fall since early Oct-12 to mid Nov-12.

Trade higher.
Today: Go long near 13000 pts., SL 30 pts. away, TG 13100 pts. / EOD.


Nasdaq 100

Long or short, dependent on which side of chart you sees.
I was prone bullish on Nasdaq 100 until it marked a new low 2493 last month (mid Nov-12), it takes out bullish wave, and the bearish wave is still going on.

Similar to Dow, Market recovering from the early Oct-12 to mid Nov-12 slide, and recovered 50%.
Overhead resistance 2700 pts. is strong, if only Nasdaq 100 can break above 2700, then it will have chance to trade higher to 2730 pts., otherwise, return to support 2630 pts.

了结巧克力,感恩我的身体

Today is the 3rd day I spend with Mercedes Nieto.  A Hungarian bellydancer.


my same foot, on the same dance floor, at the end of 2 days intensive.
I captured a similar picture last year... I appreciate this pair of feet, thankful because I am still dancing.
And survived the 2 days intensive workshop of 12 hours in total.

这对脚板,似曾相识。就在同一个Dance Floor,一年以后的脚板,还是完整无缺的在努力地舞者我们疯狂的、执着的快乐。

这一次,我再次尝试到——兴奋、期待、学习、背舞步、Memory full,记不到,大脑记忆体故障、当机、中virus & 发疯。

厚脸皮地说:在我的大脑系统当机以后,我一反常态地振奋,很糟糕地吵、也很乱来——我即喜欢我的后劲,又害怕操到这种程度以后的我,能不能回复正常。

感谢一年以来一同努力的朋友,我们见证了大家的努力,以及马来西亚肚皮舞的发展。

希望,明年的时候,我也一样保持初衷,原始地爱着我的身体,学习用舞蹈的语言,丝丝流露、传达歌曲的原意。

Monday, November 26, 2012

DJIA and Nasdaq 100


Good day traders, apologies!  I had 2 days intensive workshop with an Argentinian dancer and was busy busy for the weekend!

My home internet is down, so I am taking my rest hour to post a quick update.


DJIA and Nasdaq 100 for week starting 26 Nov 2012

Technical Analysis

DJIA

Weekly candle: bullish
Daily Candle: bullish
Intraday: bullish

Last Thursday market formed a bullish candlestick pattern making a breakout to the upside.
Reckon market to continue bullish sentiment today to hit 13050 pts.

Aggressive Long entry with intial shadow, 34 pts from opening price (12964 pts), equivalent to 12930 pts, SL 30 pts away, TG 90 pts away or if you are patient, 13050 pts.


Nasdaq 100

Weekly candle: bullish
Daily candle: bullish
Intraday: bullish

Thanks giving, turkey… ^_^ presents and celebration.

Market almost reached our target 2640 last week, pointing to high of 2639 pts.

Market is currently trading below EMA200, which is also a long term resistance line.  Unlike DJIA, Nasdaq 100 recovery is fast, and it has made a come back of more than 2/3 fibonacci retracement - I prefer to stay out.

Cheers
Ayumi

Monday, November 19, 2012

DJIA and Nasdaq 100

for the week starting 19-Nov-2012
DJIA

Last Friday, DJIA has posted a reversal candlestick pattern on daily chart, posting a low of 12470 pts.
We identify 12500 level as current support and reckon market to consolidate this week between 12500 – 12850 pts and hopefully market could retrace back to 13050 region in December before the bear take control again.

Market is doing retracement up but the major trend is still bearish, I prefer to stay out.

Nasdaq 100

Similar to Dow, market has hit 3L 2523 pts and formed new low at 2493 pts, reckon market to consolidate bias up towards 2560 pts, and hopefully return to 2600 pts before the next fall take place in December.

Nasdaq 100 is trading as 2540, Daily Trading hunt Long near support 2535 pts, TG 2560 or close EOD.

Thursday, November 15, 2012

Updates on Thu 15 Nov 2012

Like Christmas is Coming~ :)
I am going to get the song "Spring" choreographed!
These songs were from Karim Nagi latest album "Arabized", very cool crossovers.

FOMC
Minutes
Bloomberg Video

DJIA

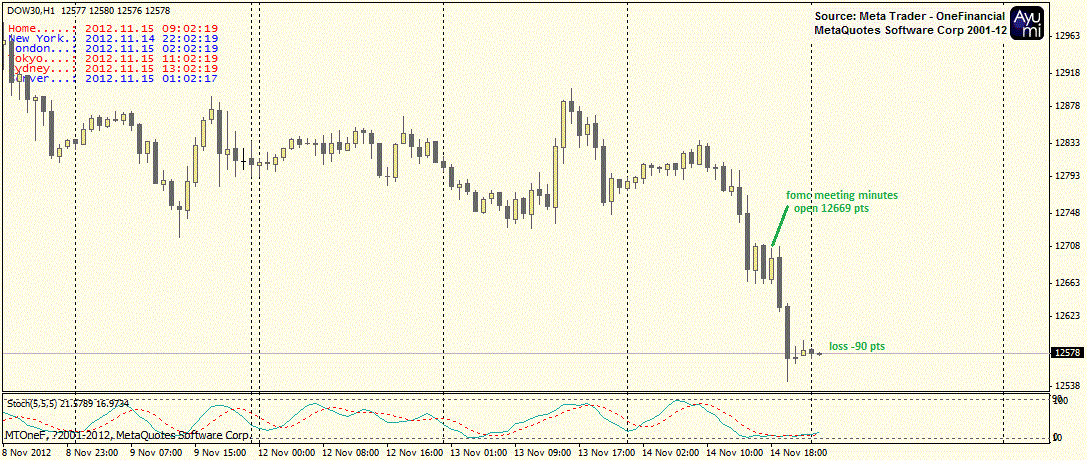
Market shed 90 pts after FOMC meeting minutes

My long trade on Nasdaq100 has triggered SL immediately at the following hour.

Market break below previous low without much upward retracement, not even 1/3;
Forecast market to continue extension to 3L at 12,400 pts

Check DJIA daily chart:
Strong support at 12450 pts, so if we get an opportunity to short, I may exit around 12400 - 450 pts.


Nasdaq 100

Last trading at 2530, not much room to reach target, target 2523, previous support 2522.


Gold

Weekly Chart
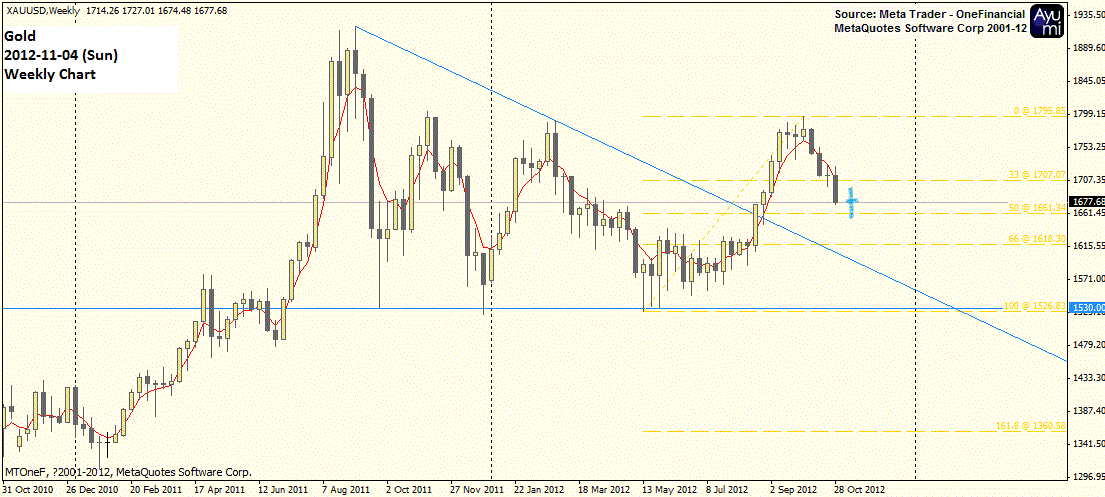
With the bullish candlestick pattern last week, I reckon market to head up, although I am not that convinced as Gold didn't reach 50% retracement level to $1661.

Daily Chart
Gold has posted a handsome reversal when it touches EMA200, as u know I am not convinced, but if market were to continue bullish sentiments, i take 1:1 target price near $1784.


Intraday Chart
Same support were seen in 4H chart, there are a few inner wave plotted.

Gold last traded at $1725, reckon market to trade within this symmetrical triangle, breaking up or down.
breaking down to $1705, breaking up to complete 1:1 and reach $1784.

Monday, November 12, 2012

DJIA and Nasdaq 100


for week Starting 12-Nov-2012

Economic Data release: US Retail Sales Report (Nov 14), FOMC Meeting Minutes (Nov 14)
Short-term effects of super storm Sandy, longer-term fears about and consequences of "fiscal cliff" will make U.S. economy unstable, tough to predict

DJIA edged up 4.07 pts. last Friday, to 12,815.39 pts. at the close, Nasdaq 100 gained 9.29 pts. to 2904.87 at the close.  For the week, DJIA fell 2.1% and Nasdaq 100 lost 2.6%.

News are about election, post election sell off, then fiscal cliff - the agreement on spending cuts and tax increases that are due to kick in early 2013.  There is not election to distract us, and fiscal cliff fears, Sandy aftermath may send market lower in coming weeks.

Ever since we mentioned here that DJIA weekly chart has confirmed the bearish candlestick pattern (related post here)
Oct 1 : http://ayumi216.blogspot.com/2012/10/djia-and-nasdaq-100.html
Oct 22 : http://ayumi216.blogspot.com/2012/10/djia-and-nasdaq-100_22.html

Market has posted series of black candle on daily chart and has reached my target 12800 with a slightly longer tail on weekly chart.


Daily Chart:
Friday candlestick pattern may suggest the beginning of retracement in this bearish market.

Technically, Market shall return to 13150 pts. (also EMA20) – with the fundamental woes, we might observe the immediate resistance at 13000 (1/3 retracement level, also EMA50 in 4 hour chart).
My trading preference is to go long, at initial shadow, and close EOD.

Daily Trading setup (initial shadow : White shadow 3 pts.) entry could be around 12825 pts., SL 12775, TG 13000 or close EOD.


Nasdaq 100

Similar to Dow, we expect market to found support around 2560 pts. (2/3 Fibonacci retracement level from 3June low - 16Sep high).

Resistance 2640 pts., Strong resistance 2660 pts.

Daily Trading with initial shadow – Long 2584 SL 2579, TG 2620 or close EOD.


Monday, November 5, 2012

Gold on Week Starting 5-Nov-2012


Gold

Market has came down and testing EMA200 on Daily chart, looking at last Friday’s candle, today might be a doji candle signaling short term rebound.

Reckon market to form a doji candlestick pattern on weekly chart, and a white candle next week around $1730-1734.


This week on Gold I will be hunting Long, near $1660 levels.


Resistance : 1700, 1709 (EMA 50) if cannot break above then downward pressure shall resume, to $1618-1620 maybe?

Resistance: 1734 if market break above 1710 convincingly.

DJIA and Nasdaq 100

Forum is not available… I will resume my weekly posting when forum is accessible.

Went to Southgate, KL, on Sunday morning and danced for 3 hours learning fan veil.  Flip, flip, flip!  When the workshop is over, I can only see my fingers shivering - been holding a fan with 1.8 meters of silk material, flip them in the air, turn and dance.

They look graceful, and dancers need time to develop the right grace – holding the fan the right angle, holding them the right direction (forward or back of our hands), keeping them above the ground, and keep our body still.

Tired, but glad I learned this after 4 years.

DJIA and Nasdaq 100 Update for week Starting 5-Nov-2012

DJIA

Last week markets were closed Monday Tuesday marking the first two-day weather-related shutdown since 1888.  Sandy the Hurricane destroy businesses, households, and critical infrastructure –might be the clue to next market direction.

US employers hired more than forecast (123k) in October 2012 – payroll expanded by 171,000 following 148,000 gain in September.  Unemployment rate rose from 7.8% to 7.9%.  Thomson Reuters / University of Michigan consumer sentiment index rose last month to the highest level in 5 years (since before recession).

Election next week Tuesday-Wednesday, trade or not trade?

My opinion: Fundamentals is the underlying force of market direction, technical forecast could forecast price based on historical, pattern, support, resistance and time… when in doubt, stay out.

Technical Analysis

Market settle at 13093.16 pts last Friday (-139.46 pts), posted another black doji on Weekly Chart.

(1)    could be another long body black candle down.
(2)    Go down to test 13000 support, rebound, and trade higher within these two weeks’ trading range capped below 13,3580 pts.

Daily Chart:
Market tested 13,000 pts last week, this is also EMA200 on Daily chart, after Friday’s black candle, we expect market to test this support again, if market came down but didn’t revisit 13000, we shall have a nice upwave. Otherwise, once it fall to 12950, all the way to 12800 pts.


4 Hour Chart:

Market is trading around EMA50 support which a rebound is likely after testing 12992 (red horizontal line).
To be precise, market should rebound before touching 12992, and it will have the potential to reverse up immediately.

However, if market break below 12992 pts, then we forecast market to fall towards 12800 level.

Personally I prefer market to form new low, but above 12992 pts and start to rebound up towards tg1 13350, then tg2 13530 pts.


Nasdaq 100

I was fortunate to take profit below 2700 before market had a big hit last Friday.

From weekly chart, market has retraced 66% from recent upwave since June 2012.
2630-2640 is a good support level if market were to perform similar to DJIA.

Strong Support 25/10/12 (2611 pts) should not be broken, and if market rebound before testing 2630 – 2640 pts, we could expect market to revisit 2700, then 2750 pts.

Lets say market break below 2640 pts, and break below 2611, we could expect support near 2585 pts.

Cheers
Ayumi