
Nasdaq 100 on last day of the month.
I initiated a short trade.
Based on the understanding of the end of the consolidation, from a smaller time frame.
 I am not a master of trend line.. I don't trade with plotting a new diagonal lines then call them support / resistance, that's not me, but the pattern does suggest a little consolidation and it might end soon. This is what I see.
while it might have a little range to go up, I wanted to bet on the shorting opportunity.
 Market Entry initiated.
SL near previous high. 3020.
 Obviously, like the trend line I set earlier.. market did has some range to go, and it reached highest 3023.
Before coming down, dive even below my short trade target.
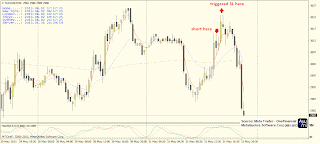 Overall, this is what happened.
I am 1-2 hours early to enter to this short trade.
Did I make a mistake?
How do I time more accurately, how to improve?
Please enlighten me if you have any.
I initiated a short trade.
Based on the understanding of the end of the consolidation, from a smaller time frame.

while it might have a little range to go up, I wanted to bet on the shorting opportunity.

SL near previous high. 3020.

Before coming down, dive even below my short trade target.

I am 1-2 hours early to enter to this short trade.
Did I make a mistake?
How do I time more accurately, how to improve?
Please enlighten me if you have any.
may i give comment on this NAS100 entry??
ReplyDeletefollowing my price action insight.. you entry on this pattern in Inside Bar after bullish fake movement.. what i want to suggest is, trading on candlestick inside bar signal. need confirmation by second candle.. :) jessie
I live/breath trendline and support/resistance analysis so I can offer a few insights. :)
ReplyDeleteMapping proper trendlines is a combination of science and art. Scientifically speaking, there are certain peaks/valleys that can be used to accurately map the trend support/resistance with the others being there to throw people off the right scent and lead them astray. The artistic part comes in looking and the price formation and determining a proper peak from just noise or blips. Over time and practice you start developing an eye for the needed details to make that determination.
What you did is straight forward and accurate, but that trend is also readily visible to all the other market players. Now if you're a major player or market maker, you know that others see a trend formation - so your "counter move" is to drive the market up to break the trend - tricking Bears to bail and luring in Bulls before you let the real trend resume.
Your loss may sting a little, but not nearly as much for those who thought the market was bullish, then got the floor pulled from underneath them for the dive down, especially if stops were missing.
To fight against these market maker maneuvers to get you out of the right position, expand your time frame. If you map starting on the 21/22, you can get a better feel for the trend moving down and in turn a higher entry point. Of course I'm likely making it sound simple, but the devil is determining what's the right time frame to use and accurately continuing the mapping during real time to know when and where to enter and exit. The thing is like with anything, the more you focus on it over time, the easier it is to see the finer details in market movement through trial, error, and correction. I'm sure it's similar to how you learned to master you powerwave method. =)
Soulfire,
DeleteThanks for putting down your comment, it has been a while I didn't read your trading/business updates ever since the Xanga deadline thing... sad.
I am new to trendline, and I seldom use them unless there're clear peaks with long tail candlestick pattern.. I am looking forward to reading more from your blog to learn your way.
Obviously changing to a higher time frame provides great insight, your idea, everyone gets to see the same trend line hit me!
Thanks for the clue SoulFire :)