Monday, November 3, 2014

DJIA on Mon 3-Nov-2014

DJIA

Has posted a strong weekly candle after the reversal confirmation.
My forecast was for it to retrace / sideways for 1 week, before hitting target.
However, I am wrong, DJIA shows its superbull and hit target, break resistance and close above resistance.

Weekly Chart


Daily Chart


base on Dow theory, DJIA is in a strong up trend - higher high - higher low.

Coming up next is to hit is main wtp 17630 (3L)
and if the strong bull continues,
inner wtp 18270 (6L)

4 Hour Chart

I do not have setup to enter a super bull market, candles are way above EMA50 and there might be no pull back... if there is a pull back: enter long at 16950 pts will be desirable.


Resistance:
18300 pts
17630 pts
17530 pts
Support
17200 pts
16950 pts
16630 pts

Tuesday, October 28, 2014

DJIA on 28-Oct-2014

This week is very important because the FED will end the QE, at least this round..

Weekly Chart

I am happy because the weekly candle has just confirmed a possible reversal.
It closes above 16700, higher than the mid point of previous bearish candle.


Daily Chart
Daily chart turning positive, it has break above EMA200 and most of the moving averages are turning upward.

I wish for a bull but I am also concerned with the resistance around 16950 - 17000 levels.
Not too optimistic, but, If DJIA could break above 17000 then we might see 17200 soon (4L wtp).


This week should be a ranging week, with some potential to return to 16630 level (which is again my favourite setup).
If support 16,630 pts hold strong, DJIA can return to 16880 and retest its resistance 16950 - 17000 pts.

Once DJIA break above 17000, we shall see 17200 soon, may be another week.

Cheers
Ayumi

Friday, October 24, 2014

DJIA on 24-Oct-2014

Daily Chart
Yeah, a white candle :D

4 Hour Chart
Hope for another positive - little range day.

I hope Dow could close above 16,800 pts to confirm reversal on weekly chart.
As forecast, Dow posted a white candle on daily chart yesterday, and hopefully the bull continue.

Strong Support near 16,530 - risk it or not, I might enter an impulsive long near 16,630 pts if market keep the sentiment high until Euro hours.

If failed, I would long at 16,530 pts again.
Target for the week at 16,780 pts.

ATR 275 pts, good range.

Cheers
Ayumi

Thursday, October 23, 2014

DJIA on 23-Oct-2014

Weekly Chart


I am looking forward to a sudden surge up this evening or Friday, to mark a white candle on weekly chart, in order to confirm the possible reversal since last week.

Daily Chart
Last night's candle is bearish.
Yeah luckily I short :)

It seems like EMA200 is currently a strong resistance to break.


4 Hour Chart
My favourite setup.
Very likely to enter long, SL at low.

Warming up~~~
hope I could enter Long for Dow soon, again.

Cheers
Ayumi

Thursday, August 14, 2014

GBP/USD on 14-Aug-2014

Again, we witnessed EMA50 in 4 hour chart...


Unfortunately I am in bed...
I recall the most frequent sentence:
what you do when you are right, and what action you take when you are wrong.
It matters so much.

Cheers
Ayumi

Monday, August 11, 2014

Weekly Forecast (FX)

for the week starting 11 Aug 2014

GBP/USD

Daily Chart bearish sentiment continues.
It has break two support level I quoted, and currently trading around 1.6770.

Dow theory - lower high, lower low.
find opportunity to short, final support at 1.6690.

Trading Plan
Initial Shadow
Short 1.6785
SL 20 pips
TG 60 pips

EUR/USD

slight bearish.
Trading at resistance level (4H chart).

I foresee market to trade sideways between 1.3340 - 1.3450.

Breaking above 1.3450 might turn EUR/USD from slight bearish to slight bullish sentiment.
Weekly Chart is suggesting a reversal pattern.

Regards
Ayumi

Wednesday, August 6, 2014

Transaction

hm... this is an impulsive trade.
First trade on minor pair.

Base on 1 hour chart divergence.

GBP/JPY short.
Short at 173.32
SL 30 pips
TG 60 pips / close after 1 hour.


GBP/USD on 6-Aug-2014


Market retest support level near 1.6810, rebounded.
from intraday chart, there's a XAB, hitting 2L.
Currently the 50% retracement has completed market could go up to 1.6930 level, but I hope market to trade sideways before hitting target 1.6930.

Trading Plan:
Pending Order to Long GBP/USD at 1.6830.
SL 1.6800 (30 or 40 pips)
TG 1.6930 (100 pips)

1.6930 is also the resistance in 4H chart (EMA50).

Cheers
Ayumi

Tuesday, July 29, 2014

Weekly Forecast (FX)

for the week starting 28-July-2014

EUR/USD
Selling pressure is high after EUR/USD break below 1.3475.

Weekly Chart

Market has break below support and Ayumi reckon selling pressure to lead EUR/USD to another low near blue line (1.3300 - 1.3350) in 2 months time (Sep-Oct 2014).


Daily Chart

bearish bearish bearish, with small Average True Range.
Immediate resistance 1.3500 - 1.3550.

Initiate Short if market failed to break and close above 1.3550.
Check 4 Hour Chart to confirm trading plan.

4 Hour Chart

4 Hour resistance at 1.3475, 25 pips higher.
Will update if any trade initiated.

GBP/USD

Interesting Market
Long term (until October 2014) bullish, target 1.7300.

Weekly Chart


Daily Chart


Affected by strong US Dollar, GBP/USD daily chart is suggesting otherwise.
Bearish sentiment - short term sell.

Day Chart
Resistance 1: 1.7030
Support 1: 1.6920 - 1.6950
Support 2: 1.6850

Cheers
Ayumi

Wednesday, July 23, 2014

Catch Up

Time slipped.

It has been almost 6 months I have not check in here.

And I missed many friends such as Soulfire, I missed AiShiang, I missed AlexSiew…

Over these 6 months, I have
March – Elena Ramazanova (from Russia) Hafla + Workshop
April – Turbo Tabla (from Korea, US / Egpyt) Hafla + Workshop
May – BDA (from Russia, Italy / Egypt) Competition + Teachers Training + Workshop
June – Sa’diyya (from USA) Hafla + Workshop
June – Dance Dance Dance 1.0 Intensive Training + Showcase
July – Dance Dance Dance 1.0 Intensive Training + Showcase

And I still missed Anusch (from Gulf) Workshop…
Coming up there will only be more workshops, training, competition, and more improvements.
My abs start to formed its shape and my arms are toned, just that they are not so feminine as I like them to be.
My body weight went from 52kg to 48kg while I build more muscles.
I hope my energy level, my metabolic rate, as well as my mind can cope with the future physical commitment.

I will do my level best to check out on Non-Farm Payroll for August, a lot of catch up to do...

I will make time for them this coming Muslim’s New Year.

Till then, wish me good luck this Sunday showcase.

Monday, February 10, 2014

DJIA and Nasdaq 100

for the week starting 10-Feb-2014

Another interesting week has passed.
DJIA has fallen drastically, went to a level too low below my previous forecast, but sustained above an important level which I will consider to change my view.

You will find this information at the comment.

I thank Yong for visiting my blog and leave his comments, that keep me aware and interested to know what's happening.

Rookie trader has started trading mini lot, he used to trade micro lot and unfortunately, he has seen his first loss during the market swing.
He didn't enter any stop loss, but he defined the take profit price.

I am strongly against this practice.. however, he made it to take $50 from the market, CL trade, 1 mini lot.  I don't know why, but he seem to be more attracted to commodities, than equities index.

DJIA

The US gained 113,000 jobs in January. The unemployment rate stands at 6.6% – little changed from the previous month. The US Non-Farm Payrolls report was expected to show a gain of around 185K in the first month of 2014 after an initial report about 74K for December. Even though significant revisions were expected, there were only 34K jobs added in November and December than previously reported. The unemployment rate was expected to stand at 6.7%, which isn’t far off the current rate of 6.6%.

Source: ForexCrunch

Last week DJIA broke below 15350, on my FXCM chart lowest is 15338 pts, slightly above the level which I consider changing my view from bullish to neutral (15200 - 15250 pts).

There are couple of bullish movement since Thursday and formed a reversal candlestick pattern on weekly chart.

I suspect the market to continue the upward momentum early of this week to reach 16,000 pts.

But beware market might swing down to test 15,550 pts before returning to 16,000 pts.
Next target 16,450 pts.

Related Post:
Forecast 20-Jan-2014 (read comments)

Cheers
Ayumi

Tuesday, January 21, 2014

DJIA and Nasdaq 100

for the week starting 20 Jan 2014

DJIA has traded far beyond 2L on a weekly chart.
Inner wave has hit 4L with little exhaustion.

Inner wave 5L target 17350 pts, which is close to 3L target on the major upwave since 2012.

I am holding a bull view until end of Quarter 1, 2014 - as long as taper is going slow.

This week Support and Resistance Levels:
R2: 16570 pts
R1: 16530 pts
Current Support: 16430 pts
S1: 16370 pts
S2: 16315 pts

Nasdaq 100

Bullish on Nasdaq 100

Similar to Dow, 5L inner wave target sits on 3710 pts.
Another 120 pts away until end of Q1Y2014.

Nasdaq 100 is always volatile but I am keeping a bullish view, will only take action when I am actively watching the market.

R2: 3630 pts
R1: 3615 pts
Current Support: 3575 pts
S1: 3560 pts
S2: 3535 pts


Tuesday, January 7, 2014

Swap

Was having this conversation with Rookie trader this morning.

What is a Swap?
I never pay attention to my Sifu when I started learning Forex, and actually, I never though I would be trading Forex... so the novice trader came to search for more information on Swap.

When I search for "Swap" at my broker (FXCM) website, I found
"Rollover" instead of swap.
I am not sure whether they mean the same thing.

I went to Forex Yard and search Swap
www.forexyard.com/en/glossary

Swap - A currency swap is the simultaneous sale and purchase of the same amount of a given currency at a forward exchange rate.

And honestly I also found a list of swap rate here...
http://www.myfxbook.com/forex-broker-swaps/fxcm/44

Saturday, January 4, 2014

Rookie Trader Open Position

EUR/USD


Open Long 1.2900 x 0.01
P/L 68.59

Weekly: Bearish
Early week: sideways bias up
Current Resistance: 1.3620
TP: 1.3630 (Make $73)

If market continue down before it come up, set
SL at 1.3550 (Make $65)


EUR/CHF
Open Long 1.2060 x 0.01
P/L 26.62


Narrow Trading Range,
Hold
Great entry


Crude Oil
Open Short 110.0 x 0.01
P/L 157.40

Bearish
Hold
Support 1 92.00
Support 2 91.75
Support 3 91.25

Wednesday, December 4, 2013

DJIA on Wed 4-Dec-2013

Profit taking after 8 weeks gain.

From weekly timeframe,
If market formed a nice black candle, it would confirm a reversal and we expect market to find support near 15700 then 15450 pts - in 2 weeks time.
Due to Christmas holiday, we expect inflationary figures like consumer price, retail sales and other fundamentals to keep market up, let's see how it goes.


From 4 hours time frame, I forecast market to test lower before ending higher this week.
Market seem to find support at current level, but have tendency to go lower.


This is how I arrive to my wave target price from smaller timeframe.

The rest is up to market and fundamentals.

Have a blissful week.
Watch out Friday NFP.

Cheers
Ayumi

Monday, November 25, 2013

DJIA and Nasdaq 100

for the week starting 25-Nov-2013

One month has passed and 1 month to Christmas!
I have picked 20 over songs for next year syllabus, collecting photos for my album cover, planning study materials and collecting events, festivals information.

Year 2014 is going to be another fun-filled year, mum always tell me:
you will know it when you need to.

Same thing goes for cooking, teaching or coaching.
Unlike installing software by plugging USB to my body, download / install new knowledge;
Experience were collected with every failure... - only if I take the opportunities, trust my instinct, work hard, and pray.

Dow posted New High above 16k
Dow has posted strong gain - above 16000 levels - another strong month for November (another 5 days to close).

The Federal Reserve maintain low interest rates to ensure smooth recovery.

Latest FOMC minutes bring tapering back to the focus but market still going higher and we believe, market will continue trading higher despite the quiet holiday month in December 2013.

Higher high, higher low, and coming week:
R2: 16450 pts
R1: 16130 pts
S1: 15980 pts
S2: 15880 pts

From technical chart, we forecast Dow to trade sideways bias down towards support 15980 pts - 16000 pts before going higher towards 16130-150 pts.
any dip below 15980 pts would present good opportunity to long, abadon long once market breached strong support level 15880 - 15900 pts.

Long 15950 pts,
SL 15900 pts
TG 16130 pts / EOD
TG2 for extreme condition 16450 pts

Monday, October 21, 2013

DJIA and Nasdaq 100

for the week starting 21-Oct-2013

Soulfire has officially 'migrated' to wordpress.
Visit his new blog address:
http://soullfire.wordpress.com/

I like it very much when soulfire pointed out my misconception:
So when the debt ceiling needs to be raised, it’s associated with prior approved spending that requires the ceiling to be raised. The key to remember here is the ceiling isn’t raised to allow the government to approve new spending, but to pay the bills of the spending that was ALREADY APPROVED. This is where many people get confused, they think raising the ceiling encourages more spending, but what it actually does is just pay for past spending obligations, not new ones.
I suggest you to read his post on Government Shut Down and Debt Ceiling Limit 101

Well I didn't post last two weeks during government shut down.
I didn't even trade.
I looked at market, lost a few hundred points, and go back alive by winning more than 200+ points in 1 day.

Back in those days, I might be immersed with trading, full of excitement, either make some money, or lost some, or being flat.
I am not sure whether I could make money trading during those extreme moments, or I could lost money, lost confidence, or lost discipline.

When market is finally back to 'normal' normal, I continue with my normal posting, blogging and having fun.
Perhaps I am not as aggressive as before, or more accurately, my dancing career has prospered and it has cast my energy away from trading.

DJIA

Techincally DJIA shall continue to rise above 15550 pts but capped below 15420 pts during early of the week.

Support 15180 pts should be a good level to look for long opportunity.

If support fails, next support is 15050 pts.

Nasdaq 100

Way to go Nasdaq 100
Stay out.

Cheers
Ayumi

Sunday, September 29, 2013

DJIA and Nasdaq 100

for the week starting 30-Sep-2013

Last trading day for September month.

Image source: http://money.cnn.com
Read their article on: Debt Ceiling

Debt ceiling is like my credit card credit limit.
So now I am the biggest consumer and the biggest client for this merchant bank, I make purchases, I stimulate businesses, I ask for anything I want, I give them businesses...
When I can't pay, I ask the bank to increase my credit limit and enjoy the 'free credit' without thinking of the consequences, nor thinking about my capability to pay.

For the debt ceiling of USD$16.699 trillion.
How many times could I expect the 'bank' increases great America their credit limit?
Where actually the money go?
Number of job is increasing, average wage isn't rising, where has 85 billion gone, back to the banks?

Technical Forecast
DJIA

Market is bearish, it shows tiny little support last week and the resistance has shifted from 15550 pts down to 15350 pts.

15188 pts is within reach just early of next week.

I have not been trading real cash for sometime.
I have the urge to trade live already... so far this year the trades were good, till date 10% capital growth is manageable,
10% is not an encouraging number to a lot of traders out there - I still see 'schools' claiming 100%  (or more!) returns - I just don't know how they make it.
I am worried that I would end up losing my discipline again.


Nasdaq 100

Last week was a volatile week for Nasdaq 100
My forecast is totally wrong.

Trader Alex Siew (check my blogroll) said: if DJIA has been falling and Nasdaq 100 is been rising, must be "boh ho kang tau" (hokkien, implies something fishy is coming up).

Technically, Nasdaq 100 shall continue trading sideways in narrow range within 3205 - 3245 bias up (though I am strong bear for DJIA).
Current Support 3218 pts.

However, if DJIA and Nasdaq 100 is co-related, once DJIA plunge below 15150 pts, I expect Nasdaq 100 to follow suit, breaking below 3204 and then sink to 3180 pts.
Otherwise, breaking above 3245 pts, next target 3260 pts.

This seem contradicting and I hope market to teach me more of their co-relations between Nasdaq 100 and DJIA.


Cheers
Ayumi

Monday, September 23, 2013

DJIA and Nasdaq 100

for the week starting 23 Sep 2013

Last Thursday during FOMC statement (Thursday 2am, GMT+8, SG/MY time), The fed surprises market with a decision not to taper, and to continue the monthly USD85billion bond purchase program.

Market is very volatile and we once again witnessed Mr Ben Bernanke's magic wand to entice the market and shock the market.

DJIA


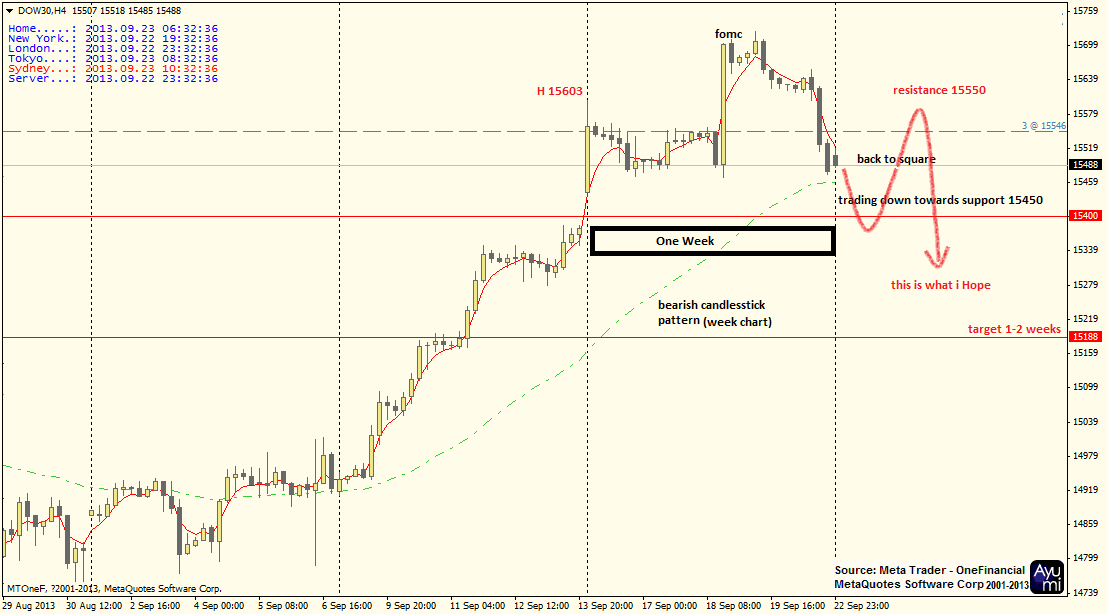
This is not only my forecast, this chart (above) outlined my hope.
First of all, I expect market to continue trading down to support 15400 - 15450 pts and reverse upward.
might face a little resistance near 15550 pts, there're two possibilities:

One:
Market resisted below 15550 pts and continue trading sideways between 15400 - 15600 pts.

Two:
Market breakout to either side, continue trading higher to 15800
or break down to 15200 pts.

Nasdaq 100

Super bull in NQ never dies.
Never tired.  Never need any rest.

Just go higher Nasdaq 100, target 3260 pts.


Cheers
Ayumi

Monday, September 16, 2013

Gold

for the week starting 16-Sep-2013

Gold has fallen below my psychological level and still going lower.
Looking at the weekly chart, I can only see continuation of bearish sentiment, next support $1280 (close to rookie's forecast)

Intraday chart (4H) gold is trading below EMA50, bearish.
Current support (last week low) $1304.

Resistance $1330
Intraday (1H) Gold is trading at oversold area and I hope technically Gold can rebound, I am hoping for rebound - as long as Gold does not trade below $1300, once Gold closed below $1300, $1280 is within reach in a day.

If Gold can sustain above $1304 (last week low) and continue trading higher, next could test resistance $1330 and return to $1355 level.

Cheers
Ayumi