GBP/USD
Monthly outlook: same, consolidation with bullish bias towards 1.6350.
Weekly Candle: 2nd indecisive candle on weekly chart, market testing important support / resistance level.
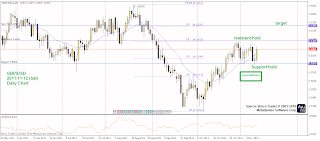
Lets look at the same chart... Daily Chart for GBP/USD
Important Resistance level: 1.6160
Important Support level: 1.5860
Last week, GBP/USD attempt to test 1.6160, but resisted at 1.6130 and came down to 1.5866 without touching either the identified support / resistance level.
In fact, I chicken out to buy when market form a bearish candle on Wednesday, it is very close to support level... However, on Thursday market form a doji, and a positive candle on Friday.
So, it is the market doing consolidation, and fulfilled the initial shadow for November month candle.
From monthly outlook, I am bullish, but patiently waiting for breakout to the top, target 1.6350.
Intraday chart (4 Hour)
Definitely a consolidation pattern.
And as per the chart, even after missing the opportunity to long near support 1.5860, we can capture long opportunity at the mid point 1.5990, with a bigger risk tolerance level...
Day Trade:
Aggressive Long at initial shadow (40 pips) 1.6020. SL 1.5970, TG 1.6150 (or EOD).
Position Trade:
Long at 1.5980 SL 1.5900 TG 1.6350.
Related:
GBP/USD on 11-Nov
GBP/USD on 8-Nov


No comments:
Post a Comment