Monday, November 5, 2012
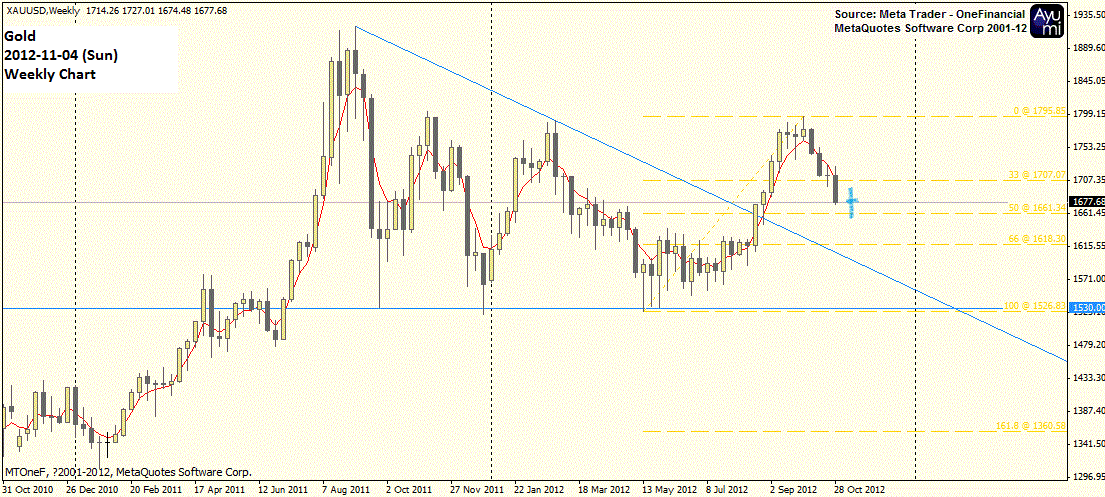
Gold on Week Starting 5-Nov-2012
Gold
Market has came down and testing EMA200 on Daily chart, looking at last Friday’s candle, today might be a doji candle signaling short term rebound.
Reckon market to form a doji candlestick pattern on weekly chart, and a white candle next week around $1730-1734.
This week on Gold I will be hunting Long, near $1660 levels.
Resistance : 1700, 1709 (EMA 50) if cannot break above then downward pressure shall resume, to $1618-1620 maybe?
Resistance: 1734 if market break above 1710 convincingly.
DJIA and Nasdaq 100
Forum is not available… I will resume my weekly posting when forum is accessible.
Went to Southgate, KL, on Sunday morning and danced for 3 hours learning fan veil. Flip, flip, flip! When the workshop is over, I can only see my fingers shivering - been holding a fan with 1.8 meters of silk material, flip them in the air, turn and dance.
They look graceful, and dancers need time to develop the right grace – holding the fan the right angle, holding them the right direction (forward or back of our hands), keeping them above the ground, and keep our body still.
Tired, but glad I learned this after 4 years.
DJIA and Nasdaq 100 Update for week Starting 5-Nov-2012
DJIA
Last week markets were closed Monday Tuesday marking the first two-day weather-related shutdown since 1888. Sandy the Hurricane destroy businesses, households, and critical infrastructure –might be the clue to next market direction.
US employers hired more than forecast (123k) in October 2012 – payroll expanded by 171,000 following 148,000 gain in September. Unemployment rate rose from 7.8% to 7.9%. Thomson Reuters / University of Michigan consumer sentiment index rose last month to the highest level in 5 years (since before recession).
Election next week Tuesday-Wednesday, trade or not trade?
My opinion: Fundamentals is the underlying force of market direction, technical forecast could forecast price based on historical, pattern, support, resistance and time… when in doubt, stay out.
Technical Analysis
Market settle at 13093.16 pts last Friday (-139.46 pts), posted another black doji on Weekly Chart.
(1) could be another long body black candle down.
(2) Go down to test 13000 support, rebound, and trade higher within these two weeks’ trading range capped below 13,3580 pts.
Daily Chart:
Market tested 13,000 pts last week, this is also EMA200 on Daily chart, after Friday’s black candle, we expect market to test this support again, if market came down but didn’t revisit 13000, we shall have a nice upwave. Otherwise, once it fall to 12950, all the way to 12800 pts.
4 Hour Chart:
Market is trading around EMA50 support which a rebound is likely after testing 12992 (red horizontal line).
To be precise, market should rebound before touching 12992, and it will have the potential to reverse up immediately.
However, if market break below 12992 pts, then we forecast market to fall towards 12800 level.
Personally I prefer market to form new low, but above 12992 pts and start to rebound up towards tg1 13350, then tg2 13530 pts.
Nasdaq 100
I was fortunate to take profit below 2700 before market had a big hit last Friday.
From weekly chart, market has retraced 66% from recent upwave since June 2012.
2630-2640 is a good support level if market were to perform similar to DJIA.
Strong Support 25/10/12 (2611 pts) should not be broken, and if market rebound before testing 2630 – 2640 pts, we could expect market to revisit 2700, then 2750 pts.
Lets say market break below 2640 pts, and break below 2611, we could expect support near 2585 pts.
Cheers
Ayumi
Went to Southgate, KL, on Sunday morning and danced for 3 hours learning fan veil. Flip, flip, flip! When the workshop is over, I can only see my fingers shivering - been holding a fan with 1.8 meters of silk material, flip them in the air, turn and dance.
They look graceful, and dancers need time to develop the right grace – holding the fan the right angle, holding them the right direction (forward or back of our hands), keeping them above the ground, and keep our body still.
Tired, but glad I learned this after 4 years.
DJIA and Nasdaq 100 Update for week Starting 5-Nov-2012
DJIA
Last week markets were closed Monday Tuesday marking the first two-day weather-related shutdown since 1888. Sandy the Hurricane destroy businesses, households, and critical infrastructure –might be the clue to next market direction.
US employers hired more than forecast (123k) in October 2012 – payroll expanded by 171,000 following 148,000 gain in September. Unemployment rate rose from 7.8% to 7.9%. Thomson Reuters / University of Michigan consumer sentiment index rose last month to the highest level in 5 years (since before recession).
Election next week Tuesday-Wednesday, trade or not trade?
My opinion: Fundamentals is the underlying force of market direction, technical forecast could forecast price based on historical, pattern, support, resistance and time… when in doubt, stay out.
Technical Analysis
Market settle at 13093.16 pts last Friday (-139.46 pts), posted another black doji on Weekly Chart.
(1) could be another long body black candle down.
(2) Go down to test 13000 support, rebound, and trade higher within these two weeks’ trading range capped below 13,3580 pts.
Daily Chart:
Market tested 13,000 pts last week, this is also EMA200 on Daily chart, after Friday’s black candle, we expect market to test this support again, if market came down but didn’t revisit 13000, we shall have a nice upwave. Otherwise, once it fall to 12950, all the way to 12800 pts.
4 Hour Chart:
Market is trading around EMA50 support which a rebound is likely after testing 12992 (red horizontal line).
To be precise, market should rebound before touching 12992, and it will have the potential to reverse up immediately.
However, if market break below 12992 pts, then we forecast market to fall towards 12800 level.
Personally I prefer market to form new low, but above 12992 pts and start to rebound up towards tg1 13350, then tg2 13530 pts.
Nasdaq 100
I was fortunate to take profit below 2700 before market had a big hit last Friday.
From weekly chart, market has retraced 66% from recent upwave since June 2012.
2630-2640 is a good support level if market were to perform similar to DJIA.
Strong Support 25/10/12 (2611 pts) should not be broken, and if market rebound before testing 2630 – 2640 pts, we could expect market to revisit 2700, then 2750 pts.
Lets say market break below 2640 pts, and break below 2611, we could expect support near 2585 pts.
Cheers
Ayumi
Sunday, October 28, 2012
Weekly Forecast (FX) + Gold
GBP/USD
Daily range : 80 pips
Current: 1.6090
Daily chart: Trading in a downward channel, ding dong up and down towards 1.5850 (EMA200) in 2 weeks time.
Intraday chart: bearish, reckon to return to equilibrium :: shall slide from current 1.6090 to 1.6045, hopefully can reach 1.6020 before posing higher.
Stay out.
USD/JPY
Daily Range: 45 pips
The central bank is expected to cut its growth and price projections at the October 30 policy meeting.
Market is led by fundamental developments - weak external demand, strong yen… how would the next stimulus package help with USD/JPY? Stay close to news and I prefer to stay out.
EUR/USD
Daily Range: 70 pips
Weekly chart: Sideways, contracting trading range, awaiting breakout.
Daily chart: current support risen up to 1.2890, resistance 1.2990. Strong support 1.2800, Strong Resistance 1.3090.
Intraday (4H) Chart: market shall continue trading in this flag pattern until Thursday / Friday.
Neutral. No trade.
XAU/USD
Daily Range: $16
Weekly Chart: Bearish, although with a star candlestick pattern, we need a confirmation if market is going to reverse up and resume up trend.
Personal bias:
We at Ayumi the Novice Trader reckon market to continue trending down from current price $1712 towards $1660, that is -$50.
Daily Chart:
Gold has posted a strong gain last Friday, from low $1700 to $1718 – and this bullish sentiment shall take a breather, retrace to $1709, and challenge $1720 again on Monday.
Trading Plan:
I will hunt for short instead of Long at support…
However, for aggressive trading : I would place a Long trade on Monday near $1709, close EOD or near resistance.
Main objective for the week would be hunting short near resistance $1715-20, target exit 1700.
chart explains far better than words:
Cheers
Ayumi
DJIA and Nasdaq 100
Dim sum breakfast with a group of fun person, help to hang a photo frame on the wall in a friend’s living room (I am not the one hanging, but I do marking and measurements), and laze the whole afternoon – made instant noodles, read news, ate chocolates, took some fresh milk, read magazine, and watch some Taiwanese drama…
Rain was heavy and I can see the rain pour from one side of the city, to the other side.
Having a Sunday like this is really cool, it has been like… 2-3 months I don’t get to rest this way, appreciate.
DJIA and Nasdaq 100 Update for week Starting 29-Oct-2012
DJIA
Market has post another black candle on weekly chart after last week’s confirmation.
While the earnings report is still on the way (more than half has reported their earnings) but I think the economic data which is due to release this week, NFP, is going to be the focus of all traders and investors.
After having the QE3 in force, election, can US create more jobs and reduces jobless rate as per the market forecast?
Crucial Friday.
Strong Support: 12950 pts.
If, DJIA break below this strong support, then it shall head down to TG1 12750. Then 12500 pts.
However, I believe market to sustain above 12950 in this coming week.
Intraday Chart (4H)
Turning Long near Friday low 13004 pts. is preferable - SL 12950 pts.
Rebound shall bring DJIA back to 13200 pts., then trade sideway bias up to test 13300 pts. (last week opening).
Yes, I am bias long in the middle of this bearish trend. Trade with caution and lets aim for another short after market face rejection around 13300 pts.
Intraday trade for Dow: Long @ 13050 – 13070, SL 13000, TG 13200.
Nasdaq 100
Bearish
Weekly: Bearish
Daily: Bearish – meeting EMA200 support, leading to short term consolidation.
4 Hour: market should rebound in coming week (similar to Dow), and I do hope the rebound could at least bring Nasdaq 100 back to 2698 – 2700 pts.
In coming month (November), lets say market rebounded to 2700 and face hard resistance, we reckon another wave of correction, sending market down south to 2570 pts.
Compare to Dow, Nasdaq 100 is more bearish and I would prefer to Long Dow, than to Long Nasdaq 100.
Cheers
Ayumi
Thursday, October 25, 2012
DJIA an Nasdaq 100
On Thu 25-Oct-2012
Nasdaq 100
I feel so like entering long... but not yet.
clue within 30 minutes chart
Trend: bearish, with momentum, strong.
approaching support 2660 but I think should trade lower soon.
2nd clue, 4 hr chart:
may be it still need a little bit of time before we accumulate enough power to reverse.
Lets spot a strong support level from daily chart:
2640 pts, Thursday (today).
DJIA
bearish, consolidation, challenging lower.
likely to hit 13050 and test below 13000 soon.
However, I don't suggest trading long unless we see rejection around 12950.
Those prefer going short, park short order near 13150-177 pts, TG 13000 (less favour).
Cheers
Ayumi
Nasdaq 100
I feel so like entering long... but not yet.
clue within 30 minutes chart
Trend: bearish, with momentum, strong.
approaching support 2660 but I think should trade lower soon.
2nd clue, 4 hr chart:
may be it still need a little bit of time before we accumulate enough power to reverse.
Lets spot a strong support level from daily chart:
2640 pts, Thursday (today).
DJIA
bearish, consolidation, challenging lower.
likely to hit 13050 and test below 13000 soon.
However, I don't suggest trading long unless we see rejection around 12950.
Those prefer going short, park short order near 13150-177 pts, TG 13000 (less favour).
Cheers
Ayumi
Monday, October 22, 2012
DJIA and Nasdaq 100
For the week starting 22-Oct-2012
World stocks, Commodity and Crude Oil fell on Friday upon fresh global economic concerns, lack of progress on Spanish bailout request.
Gold fell from $1742 region to $1720.80, $20 (more than 1 percent) – the biggest one-day slide in more than 3 months.
DJIA fell from 13550 region to 13343.51 pts., -205.43 pts. (more than 1.5 percent) – erased most of the week’s gains as the earnings from large multinationals underscored.
CBOE Volatility Index (VIX) jumped 13.5 percent to 17.06, highest level since 5th Sep 2012.
Technical forecast
DJIA
Weekly candlestick pattern:
bearish, with confirmation.
Daily candlestick pattern:
bearish
Intraday:
market is approaching the critical support 13300-350 pts., if market closed below 13300, then we shall see the bearish sentiment continue.
After Friday (19/10/2012) plunge, stochastic oscillator, is showing strong oversold and market is likely to come up, take a breath above red blue sea, then continue sinking towards 13200 pts.
This short term up move, might face resistance at 13400, or 13450 pts.
Market is unlikely to revisit 13500 level anymore unless there’re rumors to bring it up.
My trading opinion:
Hunt Short 13400. SL 13450. TG 13200.
Cheers
Ayumi
Wednesday, October 17, 2012
Gold on Wed 17-Oct-2012
Last few cycle spent 7 candles to rebound and cross $4-$5 above EMA50, and fall.
this round it took 10 candles, and how long would it takes to finally decide to break above EMA50 before coming down again?
Or it would never happen?
I will wait another 4 candles (4 x 4 hours = 16 hours) for retracement, unless market shows a strong reversal pattern in 30 mins or 60 mins chart.
Still, patience.
You are at the same time given more courage
I am going to attend the manager’s conference tomorrow and was reading about Gregory Burns this morning; he is one of the guest speakers of this event.
Things happened these few days – cd player doesn’t work, lost my phone, travelled in and out of the country, lack of sleep, market rebounded but I can’t join the trade although I believe 13300 is the critical support point for DJIA… couple of events has added emotional burden on me, I feel miserable.
I am not good at releasing my emotions onto people, I couldn’t express myself as I think it is unfair to the audience… best thing I could do to myself, is to lock myself in a dark room, recollect the miserable events, and sleep with it. When I have enough of all, I blog.
So, this blog post is a release of my emotions, so I could stand tall and walk again.
I read from Gregory Burns:
This line inspired me, counting the things I lack – is enough. I have been counting them since 12/10/2012... And I think it’s time to let go.
Goodbye to Woodwind, my iPhone4.
Wait for another chance, another week to trade the market.
From 13,300 pts. to 13,550 pts. is 250 pts., Dow30, I miss you once, but I know,
you go and you are bringing your friends and relatives, bring me multiple of 250 pts. of real profit.
Patience, Perseverance
Ayumi
Things happened these few days – cd player doesn’t work, lost my phone, travelled in and out of the country, lack of sleep, market rebounded but I can’t join the trade although I believe 13300 is the critical support point for DJIA… couple of events has added emotional burden on me, I feel miserable.
I am not good at releasing my emotions onto people, I couldn’t express myself as I think it is unfair to the audience… best thing I could do to myself, is to lock myself in a dark room, recollect the miserable events, and sleep with it. When I have enough of all, I blog.
So, this blog post is a release of my emotions, so I could stand tall and walk again.
I read from Gregory Burns:
“Everyone is imperfect. You might be born into a disabled condition, but you are at the same time given more courage. We should look at what we own ant not things we lack.”
This line inspired me, counting the things I lack – is enough. I have been counting them since 12/10/2012... And I think it’s time to let go.
Goodbye to Woodwind, my iPhone4.
Wait for another chance, another week to trade the market.
From 13,300 pts. to 13,550 pts. is 250 pts., Dow30, I miss you once, but I know,
you go and you are bringing your friends and relatives, bring me multiple of 250 pts. of real profit.
Patience, Perseverance
Ayumi
Monday, October 15, 2012
DJIA and Nasdaq 100
Lost a couple of trades, lost my phone last Friday, and confirms that my cd player is broken before weekend.
It was a fun filled weekend, I had a short trip south to Singapore, love people, love Shiraz, Clark Quay, love Shang Palace 香宫. Love food, love friends, love dancing.
Had too much of good food since last Monday.
Blessed tummy, blessed taste buds. Thanks!
I reached home by 3:30 am (about 2 hours ago), took a quick bath and I think it is a good idea to review for this coming week, before sunrise. So, here we go.
For the week starting 15-Oct-2012
Reporting season is heating up, with only 6% of S&P 500 companies having reported, 59% of companies have topped estimates – less than the average beat rate of 67% for the past 4 quarters according to Thomson Reuters data.
Half of companies have beaten on revenue, while a quarter missed profit forecasts.
Trading could be volatile for Nasdaq 100, I have trigged SL and I prefer staying out.
This week we will look ahead to economic data on retail sales, consumer price index (CPI) for September, and existing home sales.
Technical Forecast
DJIA has a losing week and it is hovering between 13350 and 13300, as you know I was hunting for long, and I have entered two long orders, both has been stopped out.
Last week was also a losing week for me.
With the earning reports coming up, I believe this week to be another volatile week.
From the weekly candle, it has confirmed a bearish momentum, but daily chart is showing support – we mentioned the crucial support level 13350 for past 2-3 weeks, and DJIA is already trading around crucial support 13350, breaking below 13300 would confirm bearish trend for next 2 – 3 weeks.
Once 13300 strong support was broken we expect DJIA return to 13000 (the lowest level in early September).
Stay out - unless market shows strength and renounce at 13300 pts., it shall then return to 13500 resistance.
Or else market break below 13300, it will plunge all the way to 13000 pts.
Cheers, I am going to hit the bed,
Ayumi
Sunday, October 7, 2012
DJIA and Nasdaq 100
For the week starting 8-Oct-2012
We mentioned 13350 pts. is the critical level for Dow, closing below 13350 pts. shall confirm bearish sentiment.
Last Monday 1/10/12: DJIA opens at 13447.80 pts., wen to the lowest point 13,425.30 on Tuesday 2/10 and close at 13610.15 pts. on Friday.
Market didn’t turn bearish, and didn’t turn bullish yet –previous easing has push up the stocks and commodity prices.
http://www.cnbc.com/id/49274085
Year 2008, when Fed announced QE in late November, market drives up by 400 pts. in a day and then spurred a month-long rally.
(buying $600 billion MBS)
Year 2010, Fed announces QE2, in November, 3/4 Nov 2010, market drives up 217 pts. in a day, continues to move up higher but tumbled 400 pts. in the following week.
(buying $600 billion Treasury Shares)
Year 2012, Fed announces QE3 in September, 13 Sep 2012, market drives up by 185 pts. in a day
(buying $40 billion of MBS per month, with no limit, open ended = no ending date)
Quantitative Easing (QE) Infinity (rumors called it) has bring market up, but capped below 13700 pts.
What we might want to know is:
1. Whether market has reached the top and
2. Whether market would tumble as investors digest this information
Its hard to tell as the election is on its way and I suspect market shall continue to trade sideways above 13350, testing 13700.
Technical Forecast
I use weekly chart to identify major support resistance and the same is plotted into daily chart.
Daily Chart: Market is supported above 13350, and if market tumbled and closed below 13300, it shall plunge to 13050 pts.
Elections, elections, elections, market is still in a major up trend, and lets say DJIA manage to break up above this overhead resistance level 13700, then it is likely to shoot up to 14000.
It shall take time, but generally we have to be patient to wait for the breakup / breakdown. Market is trading sideways as profit taking is happening.
4 Hour Chart: Bull – Bear Tug of War, market was trading below EMA50 last week of Sep 12, and stayed above EMA50 last week.
We suspect the sideways movement to continue and stay patience for the next big moves.
However, for intraday trade, we favour picking Long near EMA50 (4H) 13500 pts. SL 13450 TG 13650 pts.
Cheers
Ayumi
We mentioned 13350 pts. is the critical level for Dow, closing below 13350 pts. shall confirm bearish sentiment.
Last Monday 1/10/12: DJIA opens at 13447.80 pts., wen to the lowest point 13,425.30 on Tuesday 2/10 and close at 13610.15 pts. on Friday.
Market didn’t turn bearish, and didn’t turn bullish yet –previous easing has push up the stocks and commodity prices.
http://www.cnbc.com/id/49274085
Year 2008, when Fed announced QE in late November, market drives up by 400 pts. in a day and then spurred a month-long rally.
(buying $600 billion MBS)
Year 2010, Fed announces QE2, in November, 3/4 Nov 2010, market drives up 217 pts. in a day, continues to move up higher but tumbled 400 pts. in the following week.
(buying $600 billion Treasury Shares)
Year 2012, Fed announces QE3 in September, 13 Sep 2012, market drives up by 185 pts. in a day
(buying $40 billion of MBS per month, with no limit, open ended = no ending date)
Quantitative Easing (QE) Infinity (rumors called it) has bring market up, but capped below 13700 pts.
What we might want to know is:
1. Whether market has reached the top and
2. Whether market would tumble as investors digest this information
Its hard to tell as the election is on its way and I suspect market shall continue to trade sideways above 13350, testing 13700.
Technical Forecast
I use weekly chart to identify major support resistance and the same is plotted into daily chart.
Daily Chart: Market is supported above 13350, and if market tumbled and closed below 13300, it shall plunge to 13050 pts.
Elections, elections, elections, market is still in a major up trend, and lets say DJIA manage to break up above this overhead resistance level 13700, then it is likely to shoot up to 14000.
It shall take time, but generally we have to be patient to wait for the breakup / breakdown. Market is trading sideways as profit taking is happening.
4 Hour Chart: Bull – Bear Tug of War, market was trading below EMA50 last week of Sep 12, and stayed above EMA50 last week.
We suspect the sideways movement to continue and stay patience for the next big moves.
However, for intraday trade, we favour picking Long near EMA50 (4H) 13500 pts. SL 13450 TG 13650 pts.
Cheers
Ayumi
Monday, October 1, 2012
DJIA and Nasdaq 100
for the week starting 1-Oct-2012
Concerns over Euro zone sovereign debt issues dragged Wall Street market down last week.
Stocks ended lower but posted the best gain since Quarter 3 since 2010.
DJIA slipped 48.84 pts last Friday to close at 13,437.13 pts (-0.36%).
While September is historically the worst performing months for stocks, DJIA rallied 2.7% this month, logging the third largest gain in 2012.
For the quarter DJIA posted robust gains of 4.32%.
Generally traders are cautious about this quarter (October 1st is here!) – with the elections and fiscal cliff coming up, and we expect some profit taking to happen during next couple of months.
Technical Analysis
Concerns over Euro zone sovereign debt issues dragged Wall Street market down last week.
Stocks ended lower but posted the best gain since Quarter 3 since 2010.
DJIA slipped 48.84 pts last Friday to close at 13,437.13 pts (-0.36%).
While September is historically the worst performing months for stocks, DJIA rallied 2.7% this month, logging the third largest gain in 2012.
For the quarter DJIA posted robust gains of 4.32%.
Generally traders are cautious about this quarter (October 1st is here!) – with the elections and fiscal cliff coming up, and we expect some profit taking to happen during next couple of months.
Technical Analysis
Looking at the weekly chart we might observed that DJIA has posted a bearish candlestick pattern, and DJIA is trading at a crucial level – breaking below 13350 pts shall confirm the bearish sentiment in daily chart which sets the new trend for coming 2 weeks.
4 Hour chart has signals a bearish sentiments and market is currently resisted below 13500 pts (EMA50, 4H), Support 13350 pts.
We suggest to stay out or to short when market try to pierce above 13500 pts but failed.
Thursday, September 27, 2012
Transaction
Gold on 27 Sep 2012
4H chart
Green line is EMA50 which is the guide line i normally use to identify support/ resistance.

Last done $1756 and it seems market shifted from bullish to correction phase.
This green line which hover around $1760 has turned from support to resistance.

Above is gold 1H chart and u might identify the similar pattern - market is capped below 1760.
I hv entered a short at market ($1756). Looking forward to the south train below 1740.
4H chart
Green line is EMA50 which is the guide line i normally use to identify support/ resistance.

Last done $1756 and it seems market shifted from bullish to correction phase.
This green line which hover around $1760 has turned from support to resistance.

Above is gold 1H chart and u might identify the similar pattern - market is capped below 1760.
I hv entered a short at market ($1756). Looking forward to the south train below 1740.
Tuesday, September 25, 2012
Gold on Tue 25 Sep 2012
It was wierd, I entered at market to long Gold at $1757.73 (market order, instant execution) and I also created a pending order to long at $1755, but market didn't come down, and started to trade upwards.
Market was choppy for the past 2 weeks, but yesterday it was a smooth one...
Current support is $1755 since market has resumed upward testing this low for 3rd time in a week.
I am looking forward to Gold breaking the top resistance 1786 and trade towards March high $1790 and then August 2011 high $1800.
But, if a retracement were to happen, it could bring Gold down to $1715, then $1690.
I don't wish to see Gold testing strong support $1675 but this would be the last defence for uptrend.
In summary:
TG2: 1800
TG1: 1790
Daily Target: 1786
Current Support 1755
S1: 1715
S2: 1690
S3: 1675
Market was choppy for the past 2 weeks, but yesterday it was a smooth one...
Current support is $1755 since market has resumed upward testing this low for 3rd time in a week.
I am looking forward to Gold breaking the top resistance 1786 and trade towards March high $1790 and then August 2011 high $1800.
But, if a retracement were to happen, it could bring Gold down to $1715, then $1690.
I don't wish to see Gold testing strong support $1675 but this would be the last defence for uptrend.
In summary:
TG2: 1800
TG1: 1790
Daily Target: 1786
Current Support 1755
S1: 1715
S2: 1690
S3: 1675
Sunday, September 23, 2012
DJIA and Nasdaq 100
For the week starting 24 Sep 2012
DJIA
Last week, Apple announced iPhone 5, and the share price closing up above $700 per share.
Poor chinese manufacturing data sync with slowdown in US and UK.
We are moving closer to the quarter end and we expect traders’ to wrap up their trades while moving into a rocky / choppy 4th quarter.
With elections coming up, and a few economic data such as: consumer confidence,
pending home sales, fed balance sheet & money supply (read: CNBC link) we expect market to trade sideways in the coming week.
Stay out.
Resistance: 13660
Current support: 13500
Support: 13370
Nasdaq 100
Nasadq 100 continue moving north with a slower momentum and showing support at 2845 pts.
Expect market to trade sideways bias up.
Support: 2845 pts
Resistance: 2880 pts
Like the channel in the chart below (NASDAQ 100 4H).
DJIA
Last week, Apple announced iPhone 5, and the share price closing up above $700 per share.
Poor chinese manufacturing data sync with slowdown in US and UK.
We are moving closer to the quarter end and we expect traders’ to wrap up their trades while moving into a rocky / choppy 4th quarter.
With elections coming up, and a few economic data such as: consumer confidence,
pending home sales, fed balance sheet & money supply (read: CNBC link) we expect market to trade sideways in the coming week.
Stay out.
Resistance: 13660
Current support: 13500
Support: 13370
Nasdaq 100
Nasadq 100 continue moving north with a slower momentum and showing support at 2845 pts.
Expect market to trade sideways bias up.
Support: 2845 pts
Resistance: 2880 pts
Like the channel in the chart below (NASDAQ 100 4H).
Saturday, September 22, 2012
Work out, workshops
A dumbbell, a yoga mat, get ur health in shape.

Coming months will be workshops, workout, and more workout!
- Posted using BlogPress from my iPhone

Coming months will be workshops, workout, and more workout!
- Posted using BlogPress from my iPhone
Friday, September 21, 2012
Kind and Considerate
the vibes...
there are character you like, and some character you don't..
when it comes to those you are less favour of, would you reject? Would you send the negative vibes?
I did, to the same bloody person who (have no choice) but come in right before 6pm and give me tasks to do.
Yeah, I send the negative vibes -- and I hope it doesn't bounce back to me.
Good read from Ralph Marston:
The Greatest Success link
there are character you like, and some character you don't..
when it comes to those you are less favour of, would you reject? Would you send the negative vibes?
I did, to the same bloody person who (have no choice) but come in right before 6pm and give me tasks to do.
Yeah, I send the negative vibes -- and I hope it doesn't bounce back to me.
Good read from Ralph Marston:
The Greatest Success link
You don’t have to be famous to be important. You don’t have to be a celebrity to be successful.
You don’t have to live in opulent luxury to be rich. You don’t have to be irresponsible to be free.
You don’t have to be outrageous to be creative. You don’t have to be abusive to be impressive.
You can be quietly humble and still be amazingly effective. You can be kind and considerate and still have great influence.
Just because people don’t fall at your feet and worship you, doesn’t mean you are a failure. Quiet success is just as sweet as loud, flamboyant success, and usually much more real.
Monday, September 17, 2012
DJIA and Nasdaq 100
for the week starting 17 Sep 2012
On Thursday, Fedebral Reserve Chairman Ben Bernanke announced QE3 policy, to expand its bond purchase program of mortgage bond at USD40 billion per month, target to boost housing growth and job creation. No limit has been mentioned.
Stocks, and commodities (look at Gold!) rose last Thursday and Friday.
DJIA
In line with ECB plan to buy government bonds of struggling euro zone countries and US Federal Reserves monthly USD40 billion Bond Purchase Program has bring Dow to the highest closing level in nearly 5 years.
After this mid-week euphoria, a more sober period for market may be coming as investors and traders digest what the stimulus means in the long term.
US elections in November, tax and spending cuts, corporate earnings, if the unerlying economic data stays the same, we are going to see the market drop a bit, and trading sideways until election.
Technical Forecast:
Market to trade sideways digesting the mid-week hype.
Market has hit 2L target 13578 pts and technically it should be trading sideways.
Resistance - current high: 13650 pts
Immediate support: 13505 pts
Strong Support: 13350 pts
Sideways trading bias down towards 1/3 @ 13250-300 for the rally since July 2012.
Nasdaq 100
Nasdaq 100 has marched up to 12 years highs.
Bullish and immediate support at 2818 pts.
Strong support 2803 pts.
While we expect market to digest the stimulus announcements, market shall trade sideways in a flag pattern before resuming the up trend.
Stay out for the week while observe for trading opportunities around these support levels.
On Thursday, Fedebral Reserve Chairman Ben Bernanke announced QE3 policy, to expand its bond purchase program of mortgage bond at USD40 billion per month, target to boost housing growth and job creation. No limit has been mentioned.
Stocks, and commodities (look at Gold!) rose last Thursday and Friday.
DJIA
In line with ECB plan to buy government bonds of struggling euro zone countries and US Federal Reserves monthly USD40 billion Bond Purchase Program has bring Dow to the highest closing level in nearly 5 years.
After this mid-week euphoria, a more sober period for market may be coming as investors and traders digest what the stimulus means in the long term.
US elections in November, tax and spending cuts, corporate earnings, if the unerlying economic data stays the same, we are going to see the market drop a bit, and trading sideways until election.
Technical Forecast:
Market to trade sideways digesting the mid-week hype.
Market has hit 2L target 13578 pts and technically it should be trading sideways.
Resistance - current high: 13650 pts
Immediate support: 13505 pts
Strong Support: 13350 pts
Sideways trading bias down towards 1/3 @ 13250-300 for the rally since July 2012.
Nasdaq 100
Nasdaq 100 has marched up to 12 years highs.
Bullish and immediate support at 2818 pts.
Strong support 2803 pts.
While we expect market to digest the stimulus announcements, market shall trade sideways in a flag pattern before resuming the up trend.
Stay out for the week while observe for trading opportunities around these support levels.
Friday, September 14, 2012
Nano Mist and Yummy Chinese Food
I am not going to talk much about market.
QE3 is announced.
Gold price rallied $100 in a week, stocks new high...
====
I visit Car's International yesterday intend to do car wash.
And here is a successful upsell.
I am considering of the windscreen treatment.
He upsell me front windscreen with rear windscreen treatment.
worth RM235 (Ringgit Malaysia) equivalent to $95 SGD or $77 USD.
From Car wash which is is only RM10 / $4 SGD / $3.3 USD
Or a Front windscreen GP Coat Treatment which costs RM135 / $54 SGD / $44 USD.
I ended up doing GP Coat treatment (Front & Rear windscreen) + Polish + Wax + Nano Mist for my white color princess.
When I collect my car, she is true beaty with dashboard shine, tyre shine, I am satisfied.
Smells good too!
While I am driving home, I am hoping for rain, to test the windscreen treatment. And it rains at night before I hit the dance floor. The rain stopped when I finish dancing, teaching, I splash some plain water and wipe it dry.
It was a good day, and I am happy because everything go as planned except the sucessful upsell hahaha
=====
At night I had a bad dream, someone came into my car, and taking some strong smell chinese food, the smell from the food is good, but it is not good if it stays in the car, and stinks!
And in my dream, I still trying to hold my temper while telling this nice guy: "take laaa, take the food in the car, its alright....." but my heart is torn into pieces because my princess is so clean!!!!
I am so fake!
QE3 is announced.
Gold price rallied $100 in a week, stocks new high...
====
I visit Car's International yesterday intend to do car wash.
And here is a successful upsell.
I am considering of the windscreen treatment.
He upsell me front windscreen with rear windscreen treatment.
worth RM235 (Ringgit Malaysia) equivalent to $95 SGD or $77 USD.
From Car wash which is is only RM10 / $4 SGD / $3.3 USD
Or a Front windscreen GP Coat Treatment which costs RM135 / $54 SGD / $44 USD.
I ended up doing GP Coat treatment (Front & Rear windscreen) + Polish + Wax + Nano Mist for my white color princess.
When I collect my car, she is true beaty with dashboard shine, tyre shine, I am satisfied.
Smells good too!
While I am driving home, I am hoping for rain, to test the windscreen treatment. And it rains at night before I hit the dance floor. The rain stopped when I finish dancing, teaching, I splash some plain water and wipe it dry.
It was a good day, and I am happy because everything go as planned except the sucessful upsell hahaha
=====
At night I had a bad dream, someone came into my car, and taking some strong smell chinese food, the smell from the food is good, but it is not good if it stays in the car, and stinks!
And in my dream, I still trying to hold my temper while telling this nice guy: "take laaa, take the food in the car, its alright....." but my heart is torn into pieces because my princess is so clean!!!!
I am so fake!
Sunday, September 9, 2012
DJIA and Nasdaq 100
This week on Bloomberg Radio, on TV, I have seen the speech by Barack Obama, Michelle Obama and election is so so hot!
Might be interesting to read about this:
Forex Flash: Time to stop worrying about the EUR and to start worrying about the USD
There are many news, and expectation on QE, is QE3 possible?
many would have hoped for QE3, and does US really has capacity to print more and flush their currency value down?
If we look into USD Index, it has traded sharply lower last Friday - closed below 200 days EMA @ 80.16 for the first time since Oct 2011.
Since QE is not on the table, and whether Fed is going to give the fix or not is unclear, I reckon EMA200 to give support, and I expect USD Index to rebound next 2-3 days and return to 80.80 region.
DJIA
It has turned from bearish to bullish without touching 12950, although initially we at Ayumi the Novice trader thinks that it should fall!
However, DJIA still capped below 13350 pts, and we are unsure of the next direction.
Check the intraday chart below:
DJIA 4 Hours Chart:
Broke up the channel and traded the similar range up, but still capped below resistance.
both 30 mins & 1 hour chart didn't show oversold nor tendency to turn down from current momentum, and neither giving clue of the next direction.
I prefer to stay out and observe unless intraday 30 mins / 1 hour chart has approached 13350 pts, resisted down, or breakup this resistance.
Till then I have no position but watching other instruments like Gold and CL or trading the USD Index till mid week after the adjustment has completed.
Nasdaq 100
It came out on the headline that Nasdaq 100 has ended highest since 2000.
Google it.
Bullish momentum.
Can only trade with initial shadow, not sure where the bullish momentum will stop.
Initial shadow is 6 pts, day range is 30 pts.
If you have traded the Nasdaq 100, you know it is very rare chance for traders to get in at initial shadow if the day is set to fly... repeat: it is very hard to get in, but once u are there in the right move, it is like an unlimited fortune, happy hunting.
Cheers
Ayumi
Might be interesting to read about this:
Forex Flash: Time to stop worrying about the EUR and to start worrying about the USD
There are many news, and expectation on QE, is QE3 possible?
many would have hoped for QE3, and does US really has capacity to print more and flush their currency value down?
If we look into USD Index, it has traded sharply lower last Friday - closed below 200 days EMA @ 80.16 for the first time since Oct 2011.
Since QE is not on the table, and whether Fed is going to give the fix or not is unclear, I reckon EMA200 to give support, and I expect USD Index to rebound next 2-3 days and return to 80.80 region.
DJIA
It has turned from bearish to bullish without touching 12950, although initially we at Ayumi the Novice trader thinks that it should fall!
However, DJIA still capped below 13350 pts, and we are unsure of the next direction.
Check the intraday chart below:
DJIA 4 Hours Chart:
Broke up the channel and traded the similar range up, but still capped below resistance.
both 30 mins & 1 hour chart didn't show oversold nor tendency to turn down from current momentum, and neither giving clue of the next direction.
I prefer to stay out and observe unless intraday 30 mins / 1 hour chart has approached 13350 pts, resisted down, or breakup this resistance.
Till then I have no position but watching other instruments like Gold and CL or trading the USD Index till mid week after the adjustment has completed.
Nasdaq 100
It came out on the headline that Nasdaq 100 has ended highest since 2000.
Google it.
Bullish momentum.
Can only trade with initial shadow, not sure where the bullish momentum will stop.
Initial shadow is 6 pts, day range is 30 pts.
If you have traded the Nasdaq 100, you know it is very rare chance for traders to get in at initial shadow if the day is set to fly... repeat: it is very hard to get in, but once u are there in the right move, it is like an unlimited fortune, happy hunting.
Cheers
Ayumi
Saturday, September 8, 2012
Wednesday, September 5, 2012
Gold on Wed 5-Sep-2012
well, it is one day after labour day.
Gold forecast for the week starting 4th Sep 2012
Technical Forecast
Gold [XAU/USD] Weekly Chart
as you can see, Gold price has break above the flag pattern, and its early...
refer to my previous post I Like About Gold - Gold forecast end August.
Gold has break up above 1670 and confirmed the bullish trend, though, it is early, I am kind of surprised, and still in disbelieve. But I accept the fact that it is Bullish.
Gold Daily Chart (above)
There are 3 indications supporting the bullish view.
1. Short term bullish sentiment (1)
2. Mid term bullish sentiment (2)
3. Breaking above weekly resistance line
The bullish sentiment shall last 3-4 weeks upon this confirmation.
As previous week correction didn't come down to 50%, so I reckon market to hit another leg up to $1720 before a technical correction could happen.
If it does reached $1720 and started to correct, expect market to hold at Strong support $1675.
so.... initiate Long.
Initial shadow $5
Couldn't trade short now... although I am trained to trade reversals... [reminding myself]
Cheers
Ayumi
Gold forecast for the week starting 4th Sep 2012
Technical Forecast
Gold [XAU/USD] Weekly Chart
as you can see, Gold price has break above the flag pattern, and its early...
refer to my previous post I Like About Gold - Gold forecast end August.
Gold has break up above 1670 and confirmed the bullish trend, though, it is early, I am kind of surprised, and still in disbelieve. But I accept the fact that it is Bullish.
Gold Daily Chart (above)
There are 3 indications supporting the bullish view.
1. Short term bullish sentiment (1)
2. Mid term bullish sentiment (2)
3. Breaking above weekly resistance line
The bullish sentiment shall last 3-4 weeks upon this confirmation.
As previous week correction didn't come down to 50%, so I reckon market to hit another leg up to $1720 before a technical correction could happen.
If it does reached $1720 and started to correct, expect market to hold at Strong support $1675.
so.... initiate Long.
Initial shadow $5
Couldn't trade short now... although I am trained to trade reversals... [reminding myself]
Cheers
Ayumi
DJIA on Wed 5-Sep-2012
DJIA 1 Hour Chart
Market and break below support as my weekly forecast - shall reach 12950 pts soon.
DJIA 4 Hour Chart
Look at the bigger time frame - market is trading towards support level 12900 - 950 pts, if this support couldn't hold, then bearish momentum shall continue and 12780 pts will be next target.
Related post: DJIA Weekly Forecast
Sunday, September 2, 2012
DJIA and Nasdaq 100
Wooooo!!! September month has finally arrived!
My schedule is getting fuller and fuller, every weekends is occupied!! =)
Apart from trading, I am designing the year 2 and year 3 'syllabus' for my dance classes, and planning to renovate a vacant room to convert it to a mini dance floor. A full mirror really can't satisfy me.. i want to see more of myself :) and seeing how I look like when I am turning around... ops, back to topic.
I hope everyone is excited as I am - plan, and work hard!
DJIA forecast for the week starting 3 Sep 2012
Though Bernanke, speaking in Jackson Hole, Wyoming, dashed some hopes for a signal of quick action, his comments bolstered bets that the central bank was closer to providing more stimulus for an economy that is close to stalling.
stocks has been flat much of last week except Friday. For the month, Dow has rose 0.6%. Volume was light but above the low levels of earlier in week. The four other days this week were among the five lowest for volume all year.
Technical Analysis
Dow is currently resisted under 13150, current resistance 13100.
After the speaking in Jackson Hole market has shoot up to 13155 and brought the stochastic is high (overbought), reckon market to suffer sideways movement testing the resistance 13100 - 13150 pts in a symmetrical triangle pattern.
suggest to stay out and observe for opportunity towards breakout.
breaking up the resistance level shall lead Dow towards 13200 pts then 13350 pts.
breaking below support shall bring Dow down to 12950 pts then 12780 pts.
Nasdaq 100
Bullish on Nasdaq 100 -- it has posted the best performing month since February 2012.
all time high, what's more, breaking higher above 2800 pts will only bring Nasdaq 100 higher towards the ceiling of any chart :)
If there's a technical correction Nasdaq 100 shall fall to main support 2720 pts before the rally continues (although I don't think Nasdaq 100 would settle so low).
Apart from trading, I am designing the year 2 and year 3 'syllabus' for my dance classes, and planning to renovate a vacant room to convert it to a mini dance floor. A full mirror really can't satisfy me.. i want to see more of myself :) and seeing how I look like when I am turning around... ops, back to topic.
I hope everyone is excited as I am - plan, and work hard!
DJIA forecast for the week starting 3 Sep 2012
Though Bernanke, speaking in Jackson Hole, Wyoming, dashed some hopes for a signal of quick action, his comments bolstered bets that the central bank was closer to providing more stimulus for an economy that is close to stalling.
stocks has been flat much of last week except Friday. For the month, Dow has rose 0.6%. Volume was light but above the low levels of earlier in week. The four other days this week were among the five lowest for volume all year.
Technical Analysis
Dow is currently resisted under 13150, current resistance 13100.
After the speaking in Jackson Hole market has shoot up to 13155 and brought the stochastic is high (overbought), reckon market to suffer sideways movement testing the resistance 13100 - 13150 pts in a symmetrical triangle pattern.
suggest to stay out and observe for opportunity towards breakout.
breaking up the resistance level shall lead Dow towards 13200 pts then 13350 pts.
breaking below support shall bring Dow down to 12950 pts then 12780 pts.
Nasdaq 100
Bullish on Nasdaq 100 -- it has posted the best performing month since February 2012.
all time high, what's more, breaking higher above 2800 pts will only bring Nasdaq 100 higher towards the ceiling of any chart :)
If there's a technical correction Nasdaq 100 shall fall to main support 2720 pts before the rally continues (although I don't think Nasdaq 100 would settle so low).
Saturday, September 1, 2012
I like about Gold
For the week, I'm drenched in Gold.
Long a few times, triggered stop loss a few times ... I think 5 times in total.
Some stop loss are losses, some are little profit after market moves in favour.
I'm mentally challenged after the last time my stop loss is triggered. Yet I'm still a strong believer that.. Gold could FLY!
The last 2 attempt to Long - Gold is hovering around EMA50 (4 hrs chart).
And due to many times of losing this Long position, fear creeping in... My account is down 30%+
I only have 2 ideas:
1. Just take profit (afraid that they could go away)
So I adjusted my profit target down
2. If the Long trade is gone again and again... Just let the account burn, anyhow, I might need to experience (burning my trading account) one day.
Gold not only surge up 1670, it went up 1690.
I like the mental game, yeah, market not only made it to 2L, but 3L (powerwave), I'm happy for 2 things:
1. happy that my forecast is printed on the chart - and
2. I'm happy to discover that :
my mind is yet ready (i will work on it) - to ride the full wave.
- Posted using BlogPress from my iPhone
Long a few times, triggered stop loss a few times ... I think 5 times in total.
Some stop loss are losses, some are little profit after market moves in favour.
I'm mentally challenged after the last time my stop loss is triggered. Yet I'm still a strong believer that.. Gold could FLY!
The last 2 attempt to Long - Gold is hovering around EMA50 (4 hrs chart).
And due to many times of losing this Long position, fear creeping in... My account is down 30%+
I only have 2 ideas:
1. Just take profit (afraid that they could go away)
So I adjusted my profit target down
2. If the Long trade is gone again and again... Just let the account burn, anyhow, I might need to experience (burning my trading account) one day.
Gold not only surge up 1670, it went up 1690.
I like the mental game, yeah, market not only made it to 2L, but 3L (powerwave), I'm happy for 2 things:
1. happy that my forecast is printed on the chart - and
2. I'm happy to discover that :
my mind is yet ready (i will work on it) - to ride the full wave.
- Posted using BlogPress from my iPhone
Thursday, August 30, 2012
Transaction
Gold - XAU/USD
I hv an open position last night,
I moved SL to $1656 when I see handsome floating profit while Gold trade around $1661.
My Long position was triggered at preset stop loss last night when I was asleep.
A bit unhappy. Cuz this is the 3rd time this week this type of trade happens. SL is near. Triggered.
This morning when the sky is still dark, and I'm still feeling low - due to the losses, I create a pending order to Long at $1655.
Based on PowerWave method, this entry price should be ideal and my Stop Loss is preset at yesterday Low.
2L target is around $1674, and I preset target exit around $1670.
Waiting for Beige Book news release.

- Posted using BlogPress from my iPhone
I hv an open position last night,
I moved SL to $1656 when I see handsome floating profit while Gold trade around $1661.
My Long position was triggered at preset stop loss last night when I was asleep.
A bit unhappy. Cuz this is the 3rd time this week this type of trade happens. SL is near. Triggered.
This morning when the sky is still dark, and I'm still feeling low - due to the losses, I create a pending order to Long at $1655.
Based on PowerWave method, this entry price should be ideal and my Stop Loss is preset at yesterday Low.
2L target is around $1674, and I preset target exit around $1670.
Waiting for Beige Book news release.

- Posted using BlogPress from my iPhone
Wednesday, August 29, 2012
Waiting for Friday
There are a few economic releases traders will be eyeing Wednesday, but the main topic will once more be the Fed's symposium in Jackson Hole and the speech Fed chairman Ben Bernanke will give there Friday.
Today (Wednesday)
economic data includes:
10pm SG/MY Time: pending home sales at 10 a.m. ET
8:30pm SG/MY Time: second look at second quarter GDP, at 8:30 a.m ET.
2am SG/MY Time (Thursday)
The biggest release of the day comes at 2 p.m. ET, when the Fed puts out its beige book on the economy, which is sure to be picked over for any discussion of employment.
Read: http://www.cnbc.com/id/48816277
Hurricane Isaac is affecting the energy prices, check NYMEX Crude.
Today (Wednesday)
economic data includes:
10pm SG/MY Time: pending home sales at 10 a.m. ET
8:30pm SG/MY Time: second look at second quarter GDP, at 8:30 a.m ET.
2am SG/MY Time (Thursday)
The biggest release of the day comes at 2 p.m. ET, when the Fed puts out its beige book on the economy, which is sure to be picked over for any discussion of employment.
Read: http://www.cnbc.com/id/48816277
Hurricane Isaac is affecting the energy prices, check NYMEX Crude.
Tuesday, August 28, 2012
Transaction
Short Gold at 8:25pm (GMT+8 SG/MY Time)
Short @ $1666
SL $1669 (-$3)
TG $1649 ($17)

- Posted using BlogPress from my iPhone
Short @ $1666
SL $1669 (-$3)
TG $1649 ($17)

- Posted using BlogPress from my iPhone
Transaction
6:30pm (GMT+8, SG/MY time)
Short US30 @ 13130 pts
SL 13150 pts (20 pts)
TG 13050 (80 pts)

- Posted using BlogPress from my iPhone
Short US30 @ 13130 pts
SL 13150 pts (20 pts)
TG 13050 (80 pts)

- Posted using BlogPress from my iPhone
Monday, August 27, 2012
Transaction
I'm late, I'm in.
30 minutes chart showing bearish candlestick pattern.
Short Gold 4:40pm (GMT+8, SG/MY time)
Short 1672.50
SL 1675 (-$2.50)
TG 1652.50 ($20)

- Posted using BlogPress from my iPhone
30 minutes chart showing bearish candlestick pattern.
Short Gold 4:40pm (GMT+8, SG/MY time)
Short 1672.50
SL 1675 (-$2.50)
TG 1652.50 ($20)

- Posted using BlogPress from my iPhone
DJIA and Nasdaq 100
Topic over the last weekend was mostly on Apple Inc legal victory over Samsung Electronics Co Ltd in San Jose, California.
And main concern now is whether Federal Reserves will continue to inject stimulus in the market – a speech by Ben Bernanke this Friday at the Fed’s annual gathering in Jackson Hole, Wyoming could offer some clues.
The market could be bumpy this week ahead of Friday’s meeting.
Read: Reuters :: US Week Ahead
DJIA forecast for the week starting 27 Aug 2012
Read my previous week forecast here:
http://ayumi216.blogspot.com/2012/08/djia-and-nasdaq-100_20.html
Market failed to reach 13,350 pts but came pretty close to it, then suffer most of the fall towards the end of the week except pullback of 100 pts on last Friday.
Market has fallen to the strong support 13150 pts now, bullish momentum has slowed down and I reckon market to swing up and down between 13300 – 13050 pts these few days.
Trades could be established when market is testing resistance 13300 or support 13050, but I don’t like to enter to any trades if it was trading in between - like current level 13175 pts.
I prefer to stay out.
And main concern now is whether Federal Reserves will continue to inject stimulus in the market – a speech by Ben Bernanke this Friday at the Fed’s annual gathering in Jackson Hole, Wyoming could offer some clues.
The market could be bumpy this week ahead of Friday’s meeting.
Read: Reuters :: US Week Ahead
DJIA forecast for the week starting 27 Aug 2012
Read my previous week forecast here:
http://ayumi216.blogspot.com/2012/08/djia-and-nasdaq-100_20.html
Market failed to reach 13,350 pts but came pretty close to it, then suffer most of the fall towards the end of the week except pullback of 100 pts on last Friday.
Market has fallen to the strong support 13150 pts now, bullish momentum has slowed down and I reckon market to swing up and down between 13300 – 13050 pts these few days.
Trades could be established when market is testing resistance 13300 or support 13050, but I don’t like to enter to any trades if it was trading in between - like current level 13175 pts.
I prefer to stay out.
Sunday, August 26, 2012
i like about Gold
Gold forecast for the week starting 27 Aug 2012
for those who traded gold, you might have seen multiple bullish technical indicators showing collective bull patterns last week and the rally is driving me out of my mind.
I entered Long on 20-Aug at $1619.
wanted to place the target exit at 1639, this is a mistake, or this is done on purpose? I took profit at 1621 ($2 instead of $20).
Gold is trading near 1670.
far above my target exit.
I like it, i made some money, although not as much as I have planned to make, but my forecast has printed the chart ^.^
[padding my own shoulders]
back to the technical forecast:
Daily Chart: Finally Gold has broke up from the sideways pattern, and after 3 days of long white candle (every day average $20), market has shown some technical correction last Friday.
shall the technical correction continues, support lies at $1647-50, and i forecast market to trade sideways testing this support.
please take a look at weekly chart, gold has traded near high, gold needs to break up above 1670 to confirm the bullish trend.
Read:
Gold survey results: http://www.bloomberg.com/news/2012-08-23/gold-bulls-strongest-in-nine-months-as-hoard-builds-commodities.html
If you have read this link, you realize market sentiment is BULLISH - but i am holding a sideways bearish view, capped between 1650-1670.
Let's say gold continue technical correction to $1650, I am still having a long term bullish view on Gold, unless it settles below strong support $1630.
for those who traded gold, you might have seen multiple bullish technical indicators showing collective bull patterns last week and the rally is driving me out of my mind.
I entered Long on 20-Aug at $1619.
wanted to place the target exit at 1639, this is a mistake, or this is done on purpose? I took profit at 1621 ($2 instead of $20).
Gold is trading near 1670.
far above my target exit.
I like it, i made some money, although not as much as I have planned to make, but my forecast has printed the chart ^.^
[padding my own shoulders]
back to the technical forecast:
Daily Chart: Finally Gold has broke up from the sideways pattern, and after 3 days of long white candle (every day average $20), market has shown some technical correction last Friday.
shall the technical correction continues, support lies at $1647-50, and i forecast market to trade sideways testing this support.
please take a look at weekly chart, gold has traded near high, gold needs to break up above 1670 to confirm the bullish trend.
Read:
Gold survey results: http://www.bloomberg.com/news/2012-08-23/gold-bulls-strongest-in-nine-months-as-hoard-builds-commodities.html
If you have read this link, you realize market sentiment is BULLISH - but i am holding a sideways bearish view, capped between 1650-1670.
Let's say gold continue technical correction to $1650, I am still having a long term bullish view on Gold, unless it settles below strong support $1630.
Wednesday, August 22, 2012
Step by Step of Traders Life
I could not hold my smile while reading this article in the office.
I found this from Julia Clara blog:
http://fx-juliaclara.blogspot.com/p/step-by-step-of-traders-life_21.html
Do read!
Found a traders blog that I am gonna follow - Trading Arcade:
http://www.tradingarcade.com/
I found this from Julia Clara blog:
http://fx-juliaclara.blogspot.com/p/step-by-step-of-traders-life_21.html
Do read!
Found a traders blog that I am gonna follow - Trading Arcade:
http://www.tradingarcade.com/
Monday, August 20, 2012
DJIA and Nasdaq 100
DJIA forecast for week starting 20 August 2012
The number of unemployment ticked up from 364k (revised from 361k) to 366k without big surprise. Housing starts dropped to 764k (consensus 757k), but building permits has risen to 812k – highest since August 2008 just before Lehman. Retail sales advanced for the first time in last 4 months for 0.8% in July.
Manufacturing remains weak spot of the US economy, Philly Fed Manufacturing Index is short of expectation showing contraction in manufacturing.
Technical Forecast
Weekly Chart: Bullish, slowed down. I remain DJIA target 13350 pts. Daily Chart: Bullish – momentum is reduced- day range is contracting from 107 pts. to 68 pts.
Intraday Chart: lack of momentum and lackluster market is capped below 13300 and more booster is required to push the index higher. 30 minutes chart is showing a reversal signal indicating market is due to a correction soon.
Current support 13250, next support 13150.
Still expecting market to go up gradually to 13350 pts.
Intraday trade: Long at initial shadow near current support 13250 TG 13350 / close EOD.
Nasdaq 100
Market has moved higher and higher each day for Nasdaq 100 an it has hit our target 2748/50 without much hesitation.
Weekly Chart: weekly candle shows bullishness and market shall continue up to test pincer top 2794 (April 2012 high).
Daily Chart: bullish, day range contracted from 24 pts. to 18 pts., I think this part shall be similar to Dow, and we expect market to trade slowly towards resistance 2795.
Intraday Chart: neutral.
Current support 2765 pts., strong support 2325.
Wishing Muslims Selamat Hari Raya!
The number of unemployment ticked up from 364k (revised from 361k) to 366k without big surprise. Housing starts dropped to 764k (consensus 757k), but building permits has risen to 812k – highest since August 2008 just before Lehman. Retail sales advanced for the first time in last 4 months for 0.8% in July.
Manufacturing remains weak spot of the US economy, Philly Fed Manufacturing Index is short of expectation showing contraction in manufacturing.
Technical Forecast
Weekly Chart: Bullish, slowed down. I remain DJIA target 13350 pts. Daily Chart: Bullish – momentum is reduced- day range is contracting from 107 pts. to 68 pts.
Intraday Chart: lack of momentum and lackluster market is capped below 13300 and more booster is required to push the index higher. 30 minutes chart is showing a reversal signal indicating market is due to a correction soon.
Current support 13250, next support 13150.
Still expecting market to go up gradually to 13350 pts.
Intraday trade: Long at initial shadow near current support 13250 TG 13350 / close EOD.
Nasdaq 100
Market has moved higher and higher each day for Nasdaq 100 an it has hit our target 2748/50 without much hesitation.
Weekly Chart: weekly candle shows bullishness and market shall continue up to test pincer top 2794 (April 2012 high).
Daily Chart: bullish, day range contracted from 24 pts. to 18 pts., I think this part shall be similar to Dow, and we expect market to trade slowly towards resistance 2795.
Intraday Chart: neutral.
Current support 2765 pts., strong support 2325.
Wishing Muslims Selamat Hari Raya!
Monday, August 13, 2012
DJIA and Nasdaq 100
DJIA forecast for week starting 13 Aug 2012
Jobless claims unexpectedly slid by 6,000 to 361,000 in the week ended August 4, proving more jobs creations in market for the unemployed.
Prices of goods imported into the U.S. unexpectedly fell in July for a fourth consecutive month, reflecting lower costs for fuel and food. The 0.6 percent drop in the import-price index followed a 2.4 percent decline in June;
Costs excluding fuel decreased 0.4 percent, the biggest decline in two years.
Showing the weak global demand depressing prices.
U.S. export prices climbed 0.5 percent in July, after falling 1.7 percent the previous month. Prices of farm exports climbed 6.4 percent and those of non-farm goods decreased 0.3 percent.
Last Week
Market is generally HOPING for QE3 and pushed the index higher;
Market is bullish and as per last week forecast, the support has again moved up from 12950 to 13050 – a level showing group supports from Monday to Friday.
While market is moving closer up to target level 13350, the downward pressure on DJIA with recent corn prices (increase of raw material to food manufacturers) is looming.
Technical Forecast
Weekly Chart: Bullish, I maintain DJIA target at 13350 pts.
Daily Chart: Bullish, average day range is diminishing. Trading volume has reduced, and lower than average daily volume.
Intraday chart: potential up towards 13350 but downward pressure is developing with the resistance at 13250 pts. in line with overbought signal.
We reckon market to suffer a little bit of correction on Monday, from 13200 to 13150 pts. and then trading sideways bias up towards target.
Intraday trading preference: long near 13150, close EOD or near 13300-13350.
Nasdaq 100
Nasdaq 100 has posted another strong gains, and group support level moves up to 2706 and our target remains at 2748 – 2750 pts.
Hunt for long at daily initial shadow near 2718 pts., close EOD or target level 2748.
Cheers
Ayumi
Jobless claims unexpectedly slid by 6,000 to 361,000 in the week ended August 4, proving more jobs creations in market for the unemployed.
Prices of goods imported into the U.S. unexpectedly fell in July for a fourth consecutive month, reflecting lower costs for fuel and food. The 0.6 percent drop in the import-price index followed a 2.4 percent decline in June;
Costs excluding fuel decreased 0.4 percent, the biggest decline in two years.
Showing the weak global demand depressing prices.
U.S. export prices climbed 0.5 percent in July, after falling 1.7 percent the previous month. Prices of farm exports climbed 6.4 percent and those of non-farm goods decreased 0.3 percent.
Last Week
Market is generally HOPING for QE3 and pushed the index higher;
Market is bullish and as per last week forecast, the support has again moved up from 12950 to 13050 – a level showing group supports from Monday to Friday.
While market is moving closer up to target level 13350, the downward pressure on DJIA with recent corn prices (increase of raw material to food manufacturers) is looming.
Technical Forecast
Weekly Chart: Bullish, I maintain DJIA target at 13350 pts.
Daily Chart: Bullish, average day range is diminishing. Trading volume has reduced, and lower than average daily volume.
Intraday chart: potential up towards 13350 but downward pressure is developing with the resistance at 13250 pts. in line with overbought signal.
We reckon market to suffer a little bit of correction on Monday, from 13200 to 13150 pts. and then trading sideways bias up towards target.
Intraday trading preference: long near 13150, close EOD or near 13300-13350.
Nasdaq 100
Nasdaq 100 has posted another strong gains, and group support level moves up to 2706 and our target remains at 2748 – 2750 pts.
Hunt for long at daily initial shadow near 2718 pts., close EOD or target level 2748.
Cheers
Ayumi
Friday, August 10, 2012
Transaction
Short Gold at market, two hours trade.
based on candlestick pattern near resistance and stochastic overbought.
EUR/USD on Fri 10 Aug 2012
its late.. and the chart is getting exciting.
EUR/USD
it came down, touches first target.
and currently rebounded (sharply).
at the first sight, you may not want to miss this UP UP
may want to enter long immediately?
I took another sip of my Caramel Macchiato...
think back of my big picture..
yeah, I m not that bullish, and since I m having the bearish view, I m gotta stick to the plan, short at resistance.
so, looking at the current slide from 1.2450 to 1.2250, when market move up to 1.2350, I wish to short.
no, I WANT TO Short.
and this time the downward target remain at 1.2200 or 1.9950.
I hv a few pit stops here to take profit which is the support level which shall attract some pull back...
fingers crossed.
Chart attached.
EUR/USD
it came down, touches first target.
and currently rebounded (sharply).
at the first sight, you may not want to miss this UP UP
may want to enter long immediately?
I took another sip of my Caramel Macchiato...
think back of my big picture..
yeah, I m not that bullish, and since I m having the bearish view, I m gotta stick to the plan, short at resistance.
so, looking at the current slide from 1.2450 to 1.2250, when market move up to 1.2350, I wish to short.
no, I WANT TO Short.
and this time the downward target remain at 1.2200 or 1.9950.
I hv a few pit stops here to take profit which is the support level which shall attract some pull back...
fingers crossed.
Chart attached.
Thursday, August 9, 2012
EUR/USD on Wed 8-Aug-2012
Market went up towards 1.2450, without reaching the anticipated resistance level, and fall for 100 pips in 24 hrs.
The range is small, but get to expand a little bit with today's fall.
Unlike what we have anticipated - a sharp fall down, market is coming down gradually, and reach the price level which is neutral - and I anticipate another 24 hrs of sideways movement.
short term view (1 day) - sideways - bias up, towards resistance - 1.2400.
support 1.2330.
I am anticipating a resistance at 1.2400 to enter shorts with TG1: 1.2250, TG2: 1.2150.
The range is small, but get to expand a little bit with today's fall.
Unlike what we have anticipated - a sharp fall down, market is coming down gradually, and reach the price level which is neutral - and I anticipate another 24 hrs of sideways movement.
short term view (1 day) - sideways - bias up, towards resistance - 1.2400.
support 1.2330.
I am anticipating a resistance at 1.2400 to enter shorts with TG1: 1.2250, TG2: 1.2150.
Tuesday, August 7, 2012
EUR/USD on Tue 7-Aug-2012
Market is quiet, EUR is rising against USD amid the poor economic data from Germany, it is moving up towards our target level 1.2500.
This is a level I wished market could show resistance then push EUR/USD back down to what I hope to see (1.9950-1.2000).
Monday, August 6, 2012
Weekly Forecast (FX)
on 6 Aug 2012
It has been a while I don’t get an off day.
It’s the Selangor State holiday in Malaysia, so the KL stock market is open, global stock market is open. I am sitting in front of the PC, listening to Bloomberg radio, watching Live chart, while waiting for my car to be ready.
Life has been so interesting, so complete with all the activities I like. I know there are threats, robbery n its not safe even in the mall car park.. I wish all the Malaysian readers, all readers safe and blessed. Wishing all Muslims Happy Ramadan.
OK, it has been a while… I didn’t post my forecast on currency pairs unless during my bi-monthly issue in the local mandarin magazine.
EUR/USD
Technical forecast
Weekly Chart:
Market is in a bearish trend since May 2012.
Based on the cycle trend, the fall is likely to complete when market hit 1.2000 or worse 1.9950.
Daily Chart:
Although market has not hit 1.2000, it has already shown us bullish sentiment with an inverted head an shoulder pattern.
I doubt ECB would be able to rescue Greece… Spain.. Italy… Portugal.. I still have the idea that market shall fall to 1.9950 – 1.2000.
That was what I feel, based on what we see from the inverted head & shoulder pattern, and the bullish crossing of EMA4 and EMA20, market shall rise to 1.2500.
Intraday 4H Chart:
Market just posted a bearish candle, and after last Friday’s surge, a technical correction is normal, current support 1.2350, strong support 1.2250.
Intraday 60Mins and 30Mins Chart:
Not in overbought zone, I reckon after technical correction, market shall head back towards 1.2500.
Day trade, initial shadow to long near current support 1.2350 exit EOD or 1.2500.
Market is generally optimistic as Greece could meet the bailout requirement and I suppose the bullish sentiment could last for 2-3 days.
However, I still hope market to come down to 1.2000, I choose to day trade than to hold on to Long position – how could Euro continue to surge since the whole Euro Zone is in a life support system, high jobless rate, and weak economic figures?
Trade what I see. Wait what I hope.
Cheers to all
Ayumi
It has been a while I don’t get an off day.
It’s the Selangor State holiday in Malaysia, so the KL stock market is open, global stock market is open. I am sitting in front of the PC, listening to Bloomberg radio, watching Live chart, while waiting for my car to be ready.
Life has been so interesting, so complete with all the activities I like. I know there are threats, robbery n its not safe even in the mall car park.. I wish all the Malaysian readers, all readers safe and blessed. Wishing all Muslims Happy Ramadan.
OK, it has been a while… I didn’t post my forecast on currency pairs unless during my bi-monthly issue in the local mandarin magazine.
EUR/USD
Technical forecast
Weekly Chart:
Market is in a bearish trend since May 2012.
Based on the cycle trend, the fall is likely to complete when market hit 1.2000 or worse 1.9950.
Daily Chart:
Although market has not hit 1.2000, it has already shown us bullish sentiment with an inverted head an shoulder pattern.
I doubt ECB would be able to rescue Greece… Spain.. Italy… Portugal.. I still have the idea that market shall fall to 1.9950 – 1.2000.
That was what I feel, based on what we see from the inverted head & shoulder pattern, and the bullish crossing of EMA4 and EMA20, market shall rise to 1.2500.
Intraday 4H Chart:
Market just posted a bearish candle, and after last Friday’s surge, a technical correction is normal, current support 1.2350, strong support 1.2250.
Intraday 60Mins and 30Mins Chart:
Not in overbought zone, I reckon after technical correction, market shall head back towards 1.2500.
Day trade, initial shadow to long near current support 1.2350 exit EOD or 1.2500.
Market is generally optimistic as Greece could meet the bailout requirement and I suppose the bullish sentiment could last for 2-3 days.
However, I still hope market to come down to 1.2000, I choose to day trade than to hold on to Long position – how could Euro continue to surge since the whole Euro Zone is in a life support system, high jobless rate, and weak economic figures?
Trade what I see. Wait what I hope.
Cheers to all
Ayumi
DJIA and Nasdaq 100
DJIA and Nasdaq 100 for the week starting 6-Aug-2012
DJIA
Last Friday DJIA surged more than 200 points to close at 13096.17 pts after a better-than-expectation jobs report. Non-Farm Payrolls increased to 163k jobs in July, better than expectation 101k and higher than June 64k revised figure.
This sharp gains as erased 4 days losing streak. For the week, Dow rose 0.17%.
Technical Forecast:
Market has surged to 13096, support moved up to 12950. I maintain the same view, once market break above the sideways pattern, next target we are expecting market to go towards 13350.
Intraday char: market trending up with a lot of downside noise, 1 hour chart showing overbought and we suspect market to suffer a little bit of technical correction to previous group support 13050 or strong support 13000 before turning up to the target level.
Pay attention to 9pm (GMT+8 ) Fed Chairman Bernanke speaks on Monday and Tuesday.
Nasdaq 100
Similar to Dow, expect a technical pull back to 2670, or strong support 2660 before going towards 2700.
DJIA
Last Friday DJIA surged more than 200 points to close at 13096.17 pts after a better-than-expectation jobs report. Non-Farm Payrolls increased to 163k jobs in July, better than expectation 101k and higher than June 64k revised figure.
This sharp gains as erased 4 days losing streak. For the week, Dow rose 0.17%.
Technical Forecast:
Market has surged to 13096, support moved up to 12950. I maintain the same view, once market break above the sideways pattern, next target we are expecting market to go towards 13350.
Intraday char: market trending up with a lot of downside noise, 1 hour chart showing overbought and we suspect market to suffer a little bit of technical correction to previous group support 13050 or strong support 13000 before turning up to the target level.
Pay attention to 9pm (GMT+8 ) Fed Chairman Bernanke speaks on Monday and Tuesday.
Nasdaq 100
Similar to Dow, expect a technical pull back to 2670, or strong support 2660 before going towards 2700.
Subscribe to:
Posts (Atom)


