Sunday, July 28, 2013

DJIA and Nasdaq 100

for the week starting 29-Jul-2013

DJIA

Daily Chart
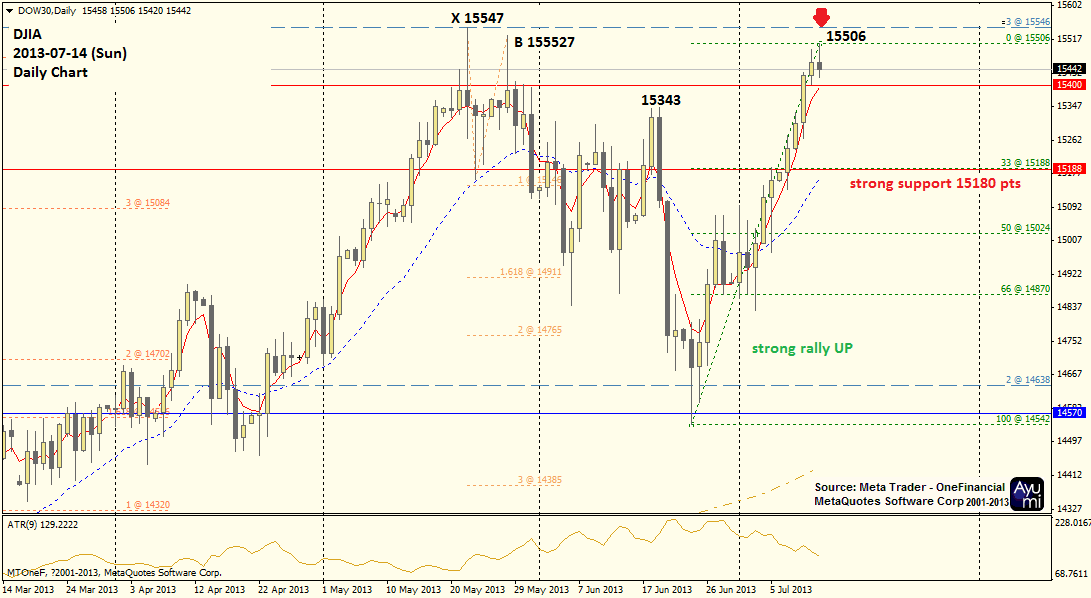
Hola! DJIA break new high, test strong support 15400.
rebounded back to 15554 pts and closed lower this week.


4 hour chart not looking good, a series of lower high, lower low from mid-end of week.


Hourly / Intraday Chart
Market is so alive last Friday.


Intraday trading at overbought level.
await pullback.

Support / Resistance
As per the chart above, this is support (S) / resistance (R) for 1-2 weeks.
R2: 15850
R1: 15620
S1: 15400
S2: 15250

Bullish
Intraday buy 15500 pts, SL 35 ots, TG 15600 or EOD.
Day range diminishing.

July is still a super bull month.
Day range reduced from 180 pts during early July to current 100 pts.

Nasdaq 100

Bullish, higher high, higher low.

R2: 3140
R1: 3090
S1: 3030
S2: 3000

Nasdaq 100 constitutes above EMA20 (D) EMA50 (4H), bullish.

Based on the way Nasdaq 100 trading lately, I would like to play safe.

Extreme Ends, Fibo Range:
Long at 3049, SL 3041, TG 3060 / EOD.
Short at 3085, SL 3093, TG 3060 / EOD.

Cheers
Ayumi

Tuesday, July 23, 2013

DJIA on Tue 23-Jul-2013

I missed the weekly forecast and I wished to update today for DJIA...

DJIA has recorded fresh high last week and I forecast the market to chase higher, but upside range is limited to 15650 pts for the time being.

There's no fresh news to fuse the market with a clear direction but I really hope to see a strong movement up towards 16,000, form a reversal candlestick pattern on day chart and consolidate.

No trade.


Wednesday, July 17, 2013

DJIA on Wed 17-Jul-2013

little joy~

please come down summore~~
Good SL at 15550, moving down.

Forecast still valid.
I maintain my bearish view even though Monday market go 1 point above previous high.


Sunday, July 14, 2013

DJIA and Nasdaq 100

for the week starting 15-July-2013

Am chillin' out at starbucks while beginning my week.
Sunday is a good start except, the aircond blower is getting strong when it is passing 1pm.

I am listening to "If I should Love Again" by Nina, from the Album: Nina feat. the Hits of Barry Manilow.
It's the first time I hear the bass detail via my new toy ~ "BassBuds".

I did quite a number of thing this morning, went to church (although being late), ate the banana chocolate muffin in Starbucks (and contributed 15% to charity), bought a limited edition tumbler, successfully edited a song for my belly-kids (using freeware Audacity).

This morning is just wonderful.

Those who follow my blog knows that I have turned from short to long.
when DJIA break above point B (15350 pts), and Nasdaq 100 has definitely made new high, finally hit 3,070 pts like I mentioned earlier, and gave up earlier.
Related Post:
27-May-2013 when I am convinced Nasdaq 100 gonna make it...
3-June-2013 when I think Nasdaq 100 is not going to tough 3070

Deceived, and made changes too often..
How come our pro-traders are so sure that market is not turning down back then?
There are many questions, and there are many more to learn.

Well, pro-traders, and seasoned traders are smart, and wise.

I am lucky, even though with different market opinion, I did not lose money these two months, instead made some.

DJIA

Weekly Chart:
Bullish
Reaching Higher
Breaking above 1550 soon
and next 15850 pts.


Daily Chart:
Bearish candlestick pattern last Friday might push DJIA down to 15,280 pts, a likely rebound might seen if market were to go towards strong support at 15180 pts.


You find that my point B has not been taken out from the daily chart and the Friday candlestick pattern suggested many resistance at this point.

If market is not going to break 15,550 pts, I am still a strong believer of downturn.
If yes, market break above this level 15,550 pts, then 15,850 pts it goes.

I will prefer to short on Monday.
Initial shadow 15490 pts.
Fibo range 15500 pts
SL 15550 pts
TG 15370 pts

If market continue to fall to 15180 pts (Strong support indicated in daily chart),
and if market show support either 15280 or 15180, I would go long.

If ... market go lower, rebound with convincing pattern (may be Tuesday):
Long 15280 pts
SL 15230 pts
TG 15450 pts.

This is what I forecast for early of the week:


Nasdaq 100

Hit 3070 level (forecast in May 2013).
This is a New high in Nasdaq 100, from the technical chart, this means bullish and it is going to hit  higher.
Next target 3092.

View: Bullish.

If you planted some gung-ho seeds in me, I might want to enter long with initial shadow 3062 pts, but erm...
It is contradicting with my DJIA forecast, and I have no trade preference in this market -- give me an Asahi may be I would do it.

Strong Support 3,020 pts.

Cheers
Ayumi

Thursday, July 11, 2013

DJIA update on Thu 11-Jul-2013

DJIA 4 hour chart

It has break previous high (marked with a curved line)
It is going to go higher towards 15550 pts now.

I abandon short for time being.
 

Sunday, July 7, 2013

Gold on Sun 7-Jul-2013

I don't like this...

Gold has been falling.
And Catching a falling knife, is not fun.

From Weekly Chart, inner wave (blue) has reached 4L wave target.
Bigger downwave (black) target is $1013 - which I don't think this can happen.

I am really HOPING gold can go up.
but I need a convincing reversal candlestick pattern to enter Long.

Gold price is trading below EMA20, EMA50, and EMA200.
STRONG bear.

Stochastic is no where at low.

Monday market is tend to go lower from current price $1222.
Towards $1200 or $1170.

Let's see.

DJIA and Nasdaq 100

for week starting 8-July-2013

Past week is a busy week.
I went north of Malaysia on Sunday (1/7) spent two nights in Penang, then back to KL for 3 days continuous training with a lot of homework (just didn't expect my training to be this intense) and at last on Friday went to Sri Kembangan for a product demo.

This week and the following week will continue to work in two time zones, literally staying awake for whole day.
Software consulting work from 9am - 6pm, dance from 8pm-10pm, traning from 11pm-4am (next day).

I think I can rest from 4am to 7am? Can hardly imagine that.
I think I love my job.

Let's review my past week forecast.
DJIA 4 Hour Chart

Last week, early of the week the forecast went well.
Remember on Thursday, I posted that I intend to enter short when market test 15100 pts again, but if reversal didn't happen, hold it.
So I didn't enter short, I didn't even watch market that hour.
Related post: [DJIA 4-Jul-2013]

A friend from Singapore PaulC left a comment in my FB, remind me to be alert that DJIA might go to 16000 pts before melting.
Well I think I should take precaution of that too.

Let's see what I see from chart and from my Support Resistance + Fibonacci + PowerWave perspective.

Monthly Chart
July candle is bullish, hopefully it stays below 15200-300 pts and close the monthly candle below 14900 pts, it looks healthy this way for bear to breed.

Otherwise my point B will be taken out, I expect market to move higher towards 15500 pts.

Weekly Chart
If I look at the chart from bottom up, recent low at 14540 has fulfilled 1/3 retracement - which means DJIA is set to go higher, towards 16650 pts.

like this:


Daily Chart
Last Friday is an interesting trading day.
it was US Independence day holiday, many observe this holiday and off but market resumed trading towards end of the market day.

It has been falling and I thought: "yeah, its coming!"

But from 30 mins chart, market had a nice fall towards 15000 level, hit EMA200 (30M), rebounded sharply and closed with a positive candle.

Federal Reserves still have strong impact in the US market, positive economic data has been a strong factor to market confidence.

8-July, Monday, I expect market to trade higher towards 15300 pts.
Support 15020 pts.
Resistance 15200 pts.

Am still looking for opportunity to short.

Trade Plan
Intend to:
Short 15220 pts
SL 15280
TG 15040

Long 14960
SL 14900
TG 15140

Nasdaq 100

Not as bullish as Dow.

No Trade.

Thursday, July 4, 2013

DJIA on Thu 4-Jul-13

This week on Dow, so far sideways Ping Pong bias down. And we are coming to Thursday.

Expect some announcements tonight and expect same movements - faster time.

For day time, I think shorting around resistance level 15,000pts can work and let's aim for a candlestick pattern with antenna top. But if it doesn't. Hold your fingers.


- Posted using BlogPress from my iPhone

Tuesday, July 2, 2013

Transaction

I went out for beer with colleagues last night and 4 of us played cards and we played the "lying dices".

It's amazing to see how some people really know how to con the others. Well it's just having fun among friends and colleagues.

During the night, I turned on Interceptor and found US30 (YM or DJIA) has tested 15000 level and stochastic level went high.

And, I placed a market order to short, giving 50 pts stop loss, reminding myself of the day range is 200-250 pts... Market might go higher to 15100 then I will give up shorting.

So i think it's reasonable and justifiable to short.

Order closed just now. Made 71 pts by shorting.

Order ticket:


Side track a bit for my early week activity.

I had fun in Penang island. Had some nice hawker food.

Went to this Sisters' Fried Kueh Teow this morning.


Sisters fried kueh teow.
And we ordered food from other stalls, they are generally good, especially the Penang Hokkien Noodles (red soup is made of prawn), the red drink is nutmeg, u should try nutmeg if you come to Penang.


- Posted using BlogPress from my iPhone

Sunday, June 30, 2013

DJIA and Nasdaq 100

for the week starting 1-July-2013

When I commit to start looking at my losing trade..
I realizes.. I commit to making the same mistake.

I went to the church this morning, visiting the church my colleague AG used to go.
The topic were not much on trading.. what surprises to me is that, during the worship I uncontrollably cried, and the tears fall like a leaking tab.

A good friend of mine, LW, he said:
"That's the hand of God, touches you. For redemption, confession".
He is just another personality that never stop surprising me.
Never underestimate someone else's pain, I am glad he has passed many tests, and challenges, and still being him, crazy fella.

Perhaps after time my wound would heal.  Perhaps after time I would embrace my limitation, and live limitless.

DJIA
Last week on DJIA, check this out:
DJIA 4 Hour Chart.

well so market went a bit higher than 2nd resistance 15000..
highest 15071 pts.

Monday market may go sideways between 14850 - 15000 pts.
If market continue to suffer below 15,071 pts, I am strong bear.
I would just love to plant shorts, and more shorts.

Aim to plant short at 15000 pts (or higher), SL slightly above high 15080.
Target exit 14850, or 14820 pts.

This is also the level where market shall find support before the next move.

Weekly Chart
From higher time frame, market still forms lower high, lower low and the power wave formation is intact.
next target to hit 14250 - 14300 pts, rebound, if the sentiment is low market might reach down to 13,900 pts in 2-3 weeks (by mid July 2013).

Nasdaq 100

I think I have double standards when it comes to Nasdaq 100 compare to DJIA.

Nasdaq 100 shall trade sideways early of week between 2880 - 2940 pts.
and there might be a potential for Nasdaq 100 to break above 2940 pts, if this happens, we expect a strong resistance at 3000 pts.

Well, I hope market capped below 2940 pts, and start the slide towards 2850 pts.
If the slide really happens, next target for this downwave is 2760 tps.

I will abandon my short view if market break above 2940 and close near 3000 pts.
This just shouldn't happen...

Cheers
Ayumi

Saturday, June 29, 2013

Transaction

Gold trade closed
Tempted to Long Dow. Dropped the idea / abandoned.

Time to bed.

Order ticket:
Revised target price to 1230$ but market range diminished and I do not want to wait. Manual close and finish work for the week.


- Posted using BlogPress from my iPhone

Friday, June 28, 2013

Gold on Fri 28-June-2013

Long Gold
Entry: $1215,
Stop Loss: $1205 ($10)
Target Exit:: $1250 ($35)

How much more should Gold drop?

It has dropped far more than what I hv forecasted earlier.


Catching a falling knife is not recommended but many can't resist the temptation.

I will be the next.

- Posted using BlogPress from my iPhone

Thursday, June 27, 2013

DJIA on Thu 27-Jun-2013

It's still Wednesday in US. Mid week.

The forecast went well and market is approaching EMA50 (4H) chart.

I'm expecting market to go slightly higher (above 14900) and close below with a reversal candlestick pattern.


- Posted using BlogPress from my iPhone

Monday, June 24, 2013

Gold on Mon 24-Jun-2013

Gold has fallen to 3L and appraoching 4L.

Strong support at $1260 which is only $20 away.
Stochastic is mid range so there might be room to go down from current price of $1283.


Strong resistance $1340.

I forecast market to trade sideways bias down towards $1260.
Short opportunity $1315
Long opportunity $1279
SL $8
TG $20-24 / close EOD.

DJIA and Nasdaq 100

for week starting 24-June-2013

I started to develop this habit of writing my forecast on a weekly basis.
And every beginning of a week, I would look back at my previous week forecast.
for week starting 17-June-2013, posted on 18-June-2013

and this is what happened:

Timing and Price is always the main clue we need to find from the chart, it is always the key to our forecast.

I am happy when my forecast for direction is right, but I am still searching the ideas to make it work for me.
I did some silly mistake last week, and a very good blogger friend shared some nice comment and made my day.
Thank you soulfire. his blog here [Xanga]

We are at the final week of June 2013.

Monthly Chart:
monthly candle is looking ugly already...
there would be some shadow below, before the close of this month's candle.

So I forecast the last trading week, DJIA break below previous month low (14690 pts), preferably test 14570 pts;
and close around 14750 pts.


Weekly Chart:
I reckon market to trade in a narrow range this week, bias down to test support 14570 pts, lowest to go 14460 pts.

Then rebound up to resistance 14850 pts before closing at 14750 pts again.
Strong resistance at 15000 pts, if market really reaches 15000 pts, I want to initiate short coupled with EMA50 strategy in 4H chart.

I would say there's nothing much this week, until a strong short signal prevails.

Nasdaq 100

Bearish

This week, Nasdaq 100 may continue to start the week falling towards 2850 pts.
There is a potential to rebound near 2850 pts, to bring Nasdaq 100 back up to 2900 pts, or strong resistance 2930 pts.

The bearish sentiment should stick unto Nasdaq 100 until end of July 2013.

I forecast Nasdaq 100 to fall towards 2757 pts, then 2680 pts, it should not break below 2580 pts to resume uptrend.

Cheers
Ayumi

Friday, June 21, 2013

Learn from Losing

Part 2

Ops I did it again.

This time the scenario is slightly worse...

The confirmation in 1 hour chart is good.
I queued to Long at 14890 pts, order filled at 11pm (GMT+8, SG/MY time), 11am DJIA time.

I parked my stop loss at 60 pts away, target profit at 100 pts away.
By looking at this chart, you know, I am right, and I am suppose to be happily making profit.
Ironically...

NO

I entered this trade with my live account, which I have withdrawn my money, leaving not more than $150 in this account.
Market continue to fall, and account margin hit.
Both my exit price were cancelled automatically, system closed my position at 14852 pts.
Loss $37.

I am terribly sorry to myself.
Who is the stupidest of all to enter into a trade with an account can't sustain $60 and get triggered?
Me
Who is the stupidest of all to enter into a trade with Live account while she has promised not to do that in 2013?
Me

That's gotta be me.
$37
Worth so many hamburgers...

Related Post:
Part 1 of my Learn from Losing [Link]

Thursday, June 20, 2013

DJIA on Thu 20-Jun-2013

Can it hit 750 this week?


Nice down !!


Yuppie Happie


- Posted using BlogPress from my iPhone


Tuesday, June 18, 2013

DJIA and Nasdaq 100


For the week starting 17 June 2013


It's Tuesday today and I just got back to my desk to start work. Many emails and updates.

It's choppy on the DJIA chart last week.

See day chart.


Weekly chart captured on Tuesday 3:15pm (GMT+8)


I shall post my forecast tonight.


- Posted using BlogPress from my iPhone


When I view my blog I get to see a lot of squares and rectangular without chart, and the font size went haywire.


DJIA and Nasdaq 100


for the week starting 17 June 2013


Looking at weekly chart, we have two reversal candlestick pattern for mid May and end May 2013.


followed by two long shadow candle for 1st and 2nd week of June.


Coming into 3rd week of June, now what?


Market has corrected for 700 pts and recovered more than 400 pts as of now at 12am, GMT+8 / 12pm, ET.


I have two contrary view this week, market shall continue choppy sessions, to break above 15,300 pts, then test resistance 15,400 pts.


Major Support 14850 pts.


hence for this week I will trade with Fibo Range.


For Tuesday:


Short 15301 pts - 15320 pts


SL 15350 pts - 15375 pts


TG 15150 pts.


Long 15090 - 15100 pts


SL 15030 pts


TG 15300 pts.


Nasdaq 100


From Weekly chart, Nasdaq 100 outlook is relatively bearish as I compare to DJIA.


Resistance at recent high 3005 pts.


Support 2,965 pts.


Fibo Range


Short 2995 - 3000 pts.


SL 3001 pts


TG 2960 pts


Long 2950 pts


SL 2930 pts


TG 2980 pts.


Sunday, June 9, 2013

FX Updates

I am thrilled...

Look at the gravity..

USD/JPY
Daily Chart

USD/JPY
4 Hour Chart

The Yen currency has devalued to a point where a correction is needed.
I think USD/JPY still have range to fall, towards 93.00.

However, any fundamental changes would help to end this correction early.
I forecast market to resume uptrend to 104.20, and 106.30 after correction.


USDX

Take a look at US Dollar Index Daily Chart..


Market has fallen to EMA200, and some slim shadow over here... hope EMA200 (gold dash-dot line) work as a net - for USDX to bounce off to 82.00 then 82.70.

I reckon a sideways bias up movement for USDX.

Forecast market to resume downtrend after this bounce, towards 81.00 then 80.00 before July 2013.